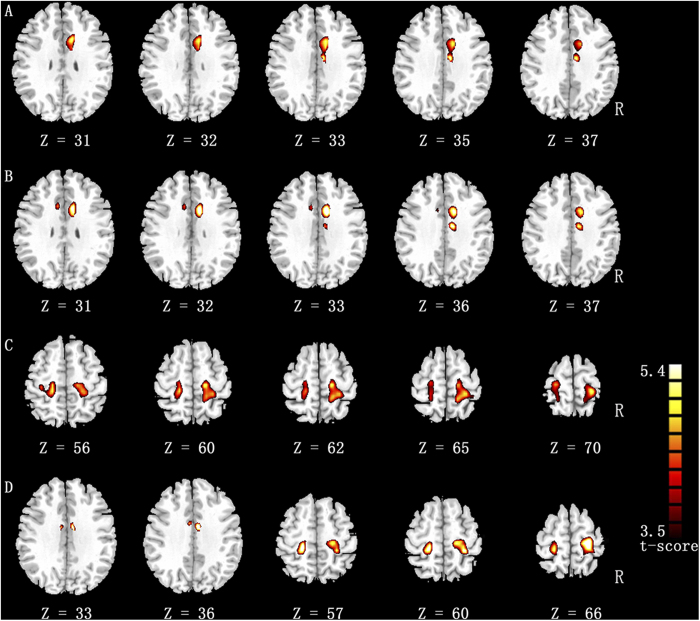
Figure 2.
The enhanced functional connections in the dance group compared with the non-dancer group (p < 0.05, FDR-corrected, cluster threshold k > 600 mm3). Row ‘A’ represents the significantly increased functional connectivity with left putamen seed and row ‘B’ reveals that of the right putamen seed. Row ‘C’ represents the significantly increased functional connectivity with left precentral seed. Row ‘D’ reveals the significantly increased functional connectivity with right postcentral seed.

