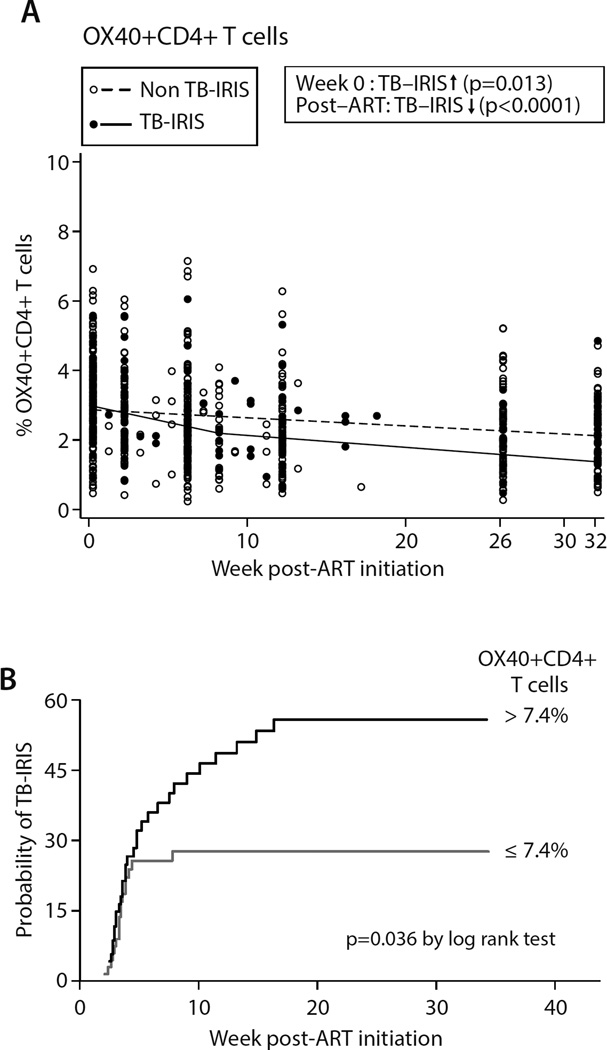
Figure 4. Differences in OX40+CD4+ T cell frequencies between TB-IRIS and non-TB-IRIS patients.
OX40+CD4+ T cell frequencies were measured in whole blood samples. Lines depict mean progression over time deduced from mixed effect linear regression models. TB-IRIS patients (filled circles and solid line) and non-TB-IRIS patients (open circles and dashed line) are shown at the actual time of sample analysis post-ART initiation in the left panel. Significant differences obtained from regression analysis in the frequency of OX40+CD4+ T cells at week 0 of ART and/or its rate of change post-ART initiation are indicated (see supplementary tables 2 and 3 for full list of p- and q-values). Up arrow = higher in TB-IRIS; down arrow = lower in TB-IRIS. Since OX40+CD4+ T cell frequencies were not normally distributed they were plotted using square root transformation. So the spread of values in each subgroup (TB-IRIS vs. non-TB-IRIS) can be better appreciated, the two patient groups are shown immediately adjacent to one another at weeks 0, 2, 6, 8, 26, and 32 post-ART in Suppl. Fig 6.
B. Plot depicting Kaplan–Meier estimates for probability of developing TBIRIS depending on pre-ART frequency of OX40+CD4+ T cells. Black line: patients with >7.4% OX40+CD4+ T cells at ART initiation; grey line: patients with ≤ 7.4% OX40+CD4+ T cells at ART initiation.

