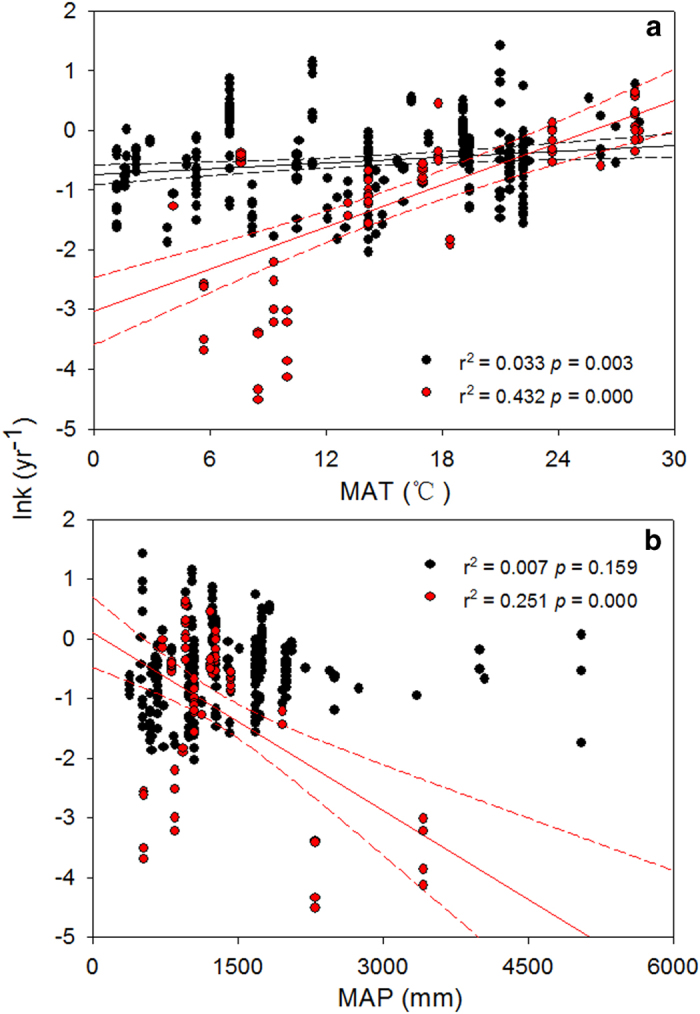
Figure 2.

Simple linear regressions between decomposition rates (ln k) and mean annual temperature and mean annual precipitation between fine and coarse roots. The solid line represents a significant linear relationship, and the dashed line is the 95% confidence interval. Black and red dots represent fine and coarse roots, respectively.
