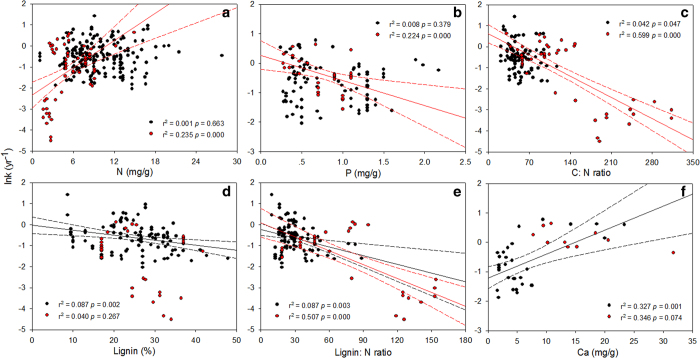
Figure 3.
Simple linear regressions between decay constants (ln k) and initial root quality for nitrogen (N) (a), phosphorus (P) (b), carbon (C) to N ratio (c), lignin (d), lignin to N ratio (e), and calcium (Ca) (f). The solid line represents a significant linear relationship, and the dashed line is the 95% confidence interval. Black and red dots represent fine and coarse roots, respectively.

