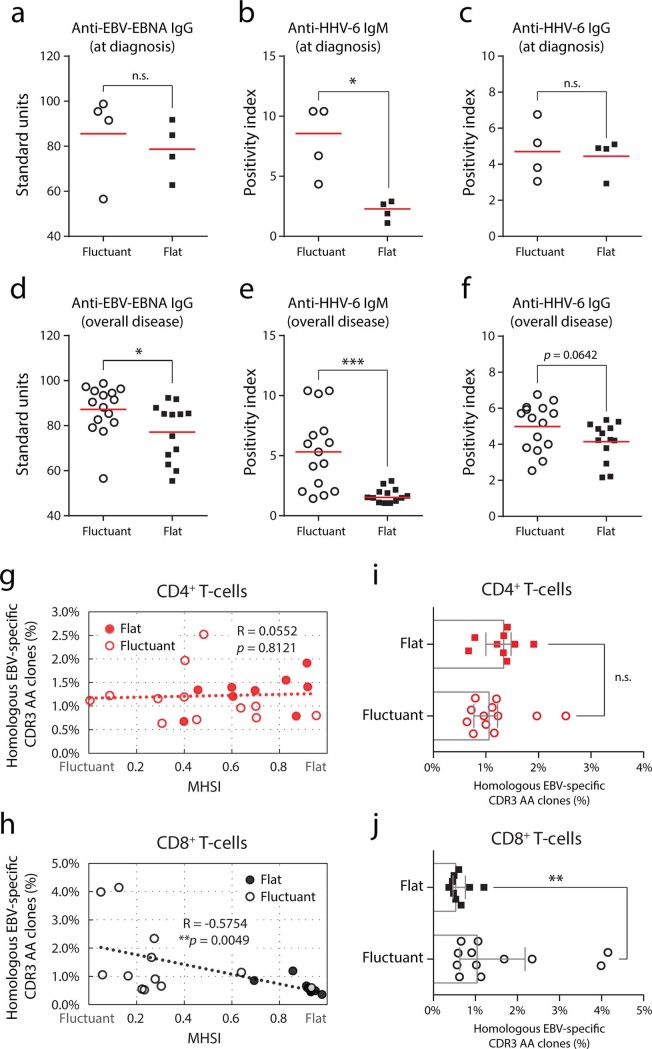
Figure 4. Abundance of the homologous EBV-specific CDR3 AA clonotypes reflects repertoire fluctuation.
(a, d) Standard units ofIgG class antibodies against the EBV–EBNA epitope in serum. (b, e) Positivity index of IgM class anti-HHV-6 antibodies in serum. (c, f) Positivity index of IgG class anti-HHV-6 antibodies in serum. (g, h) Correlation between repertoire fluctuation and the average abundance of homologous EBV-specific CDR3 AA clonotypes for each sampling interval. Pearson correlation was calculated. (i, j) Abundance of homologous EBV-specific CDR3 AA clonotypes for “flat/fluctuant” patients. Bars show the medians with interquartile ranges. Statistics based on Mann-Whitney U-test.

