
Figure 2.
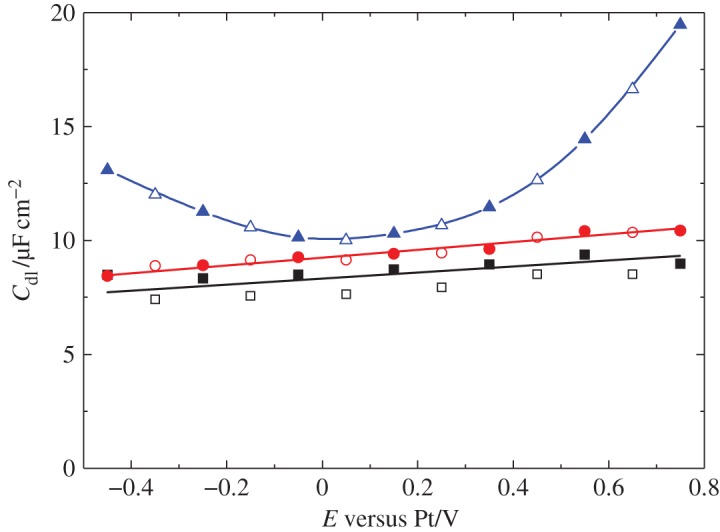
Comparison of Cdl for different substrates in scCO2/11 wt% CH3CN with 12.15 mM [NBu ][BF4] at 306 K and 15.5 MPa. Open symbols represent data taken on the cathodic scan; filled symbols on the anodic scan. Black squares: 0.5 mm diameter platinum disc; red circles: 0.5 mm diameter gold disc; blue triangles: 1 mm diameter glassy carbon disc [61]. (Reproduced with permission from [61]. Copyright XXXXXX Elsevier.)