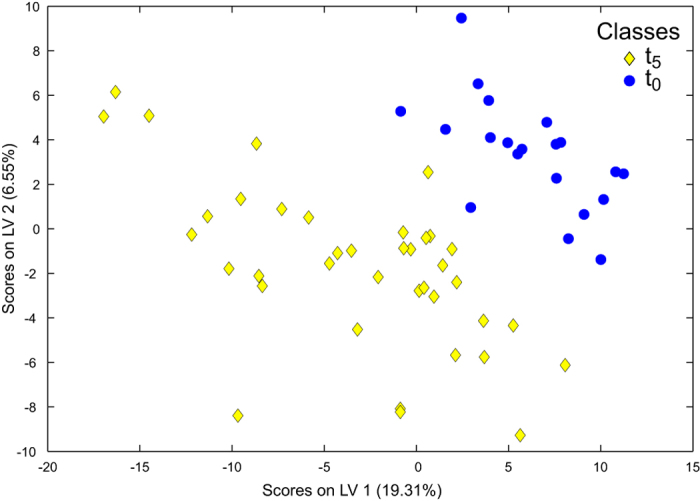
Figure 2. Discrimination of the polar metabolites extracted from Calanus spp. by experimental time point.

Partial least squares discriminant analysis of the FT-ICR mass spectra highlighting the metabolic differences between the pre-experimental (t0) and post-experimental (t5) animals (classification error rate 3.3%, p < 0.001, Table S2). Incubations were conducted in the absence of food.
