Fig. 4.

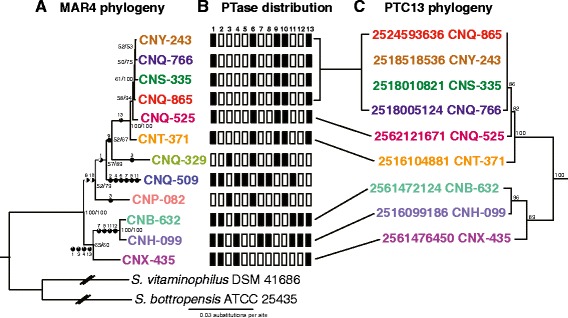
Evolutionary relationships between MAR4 strains and PTases. a MAR4 phylogeny generated from five single-copy housekeeping genes (atpD, rpoB, trpB, recA, and gyrB). Maximum likelihood (ML) and maximum parsimony (MP) trees showed the same topology. Bootstrap values >50 % are indicated at the respective nodes (MP/ML) based on 100 replicates. Black circles and associated PTC numbers indicate predicted PTase acquisition points with the % fill of the circle indicating the proportional likelihood that the PTase was present at that node (only values ≥50 % are shown). Note: some PTases are predicted to have been acquired at multiple nodes. b Boxes depict PTase distributions among MAR4 strains (black = present, white = absent). Numbers indicate the PTC. c The PTase phylogeny for each PTC was largely congruent with that of the species phylogeny for the strains in which it was observed. As an example, the phylogeny of PTC13 is depicted in comparison with the strain phylogeny. The likelihood analysis predicts two independent acquisition events for PTC13 after which the PTase phylogeny supports a model of vertical inheritance. Bootstrap values >50 % are indicated at the respective nodes (ML). IMG gene ID and the source strain for each PTase are given
