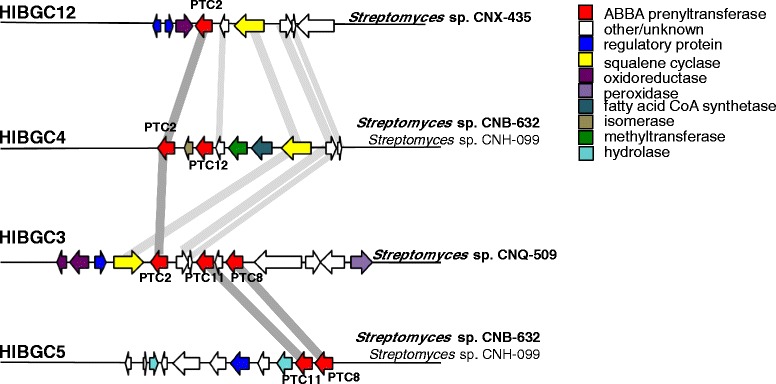
Fig. 6.

PTase rearrangement within MAR4 strains. Four HIBGCs are illustrated with putative gene functions (predicted by pfam annotations) indicated by color. Homologs are indicated by gray bars. ABBA PTases are shown in red, and the PTC associated with each PTase indicated. The strain(s) containing each HIBGC are labeled
