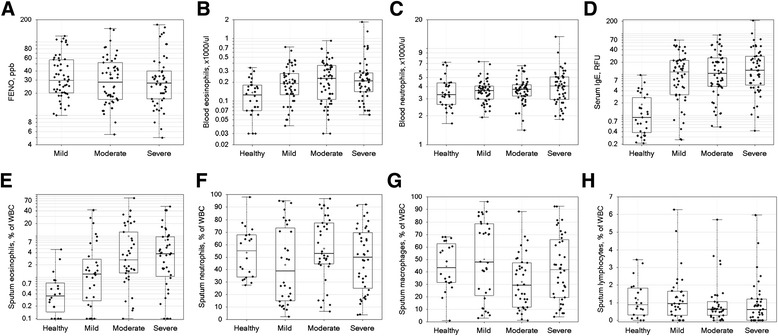
Fig. 3.

Clinical biomarkers and sputum leukocyte differentials. The values for the indicated clinical biomarkers (panels a-d) and sputum inflammatory cells (panels e-h) (y-axis) are shown for healthy control and asthma severity groups (x-axis). Data presented as symbols representing individual subjects and summarized by box (inter-quartile range and median) & whiskers (range), with ‘+’ indicating mean. Significance of differences among groups is reported in Table 4
