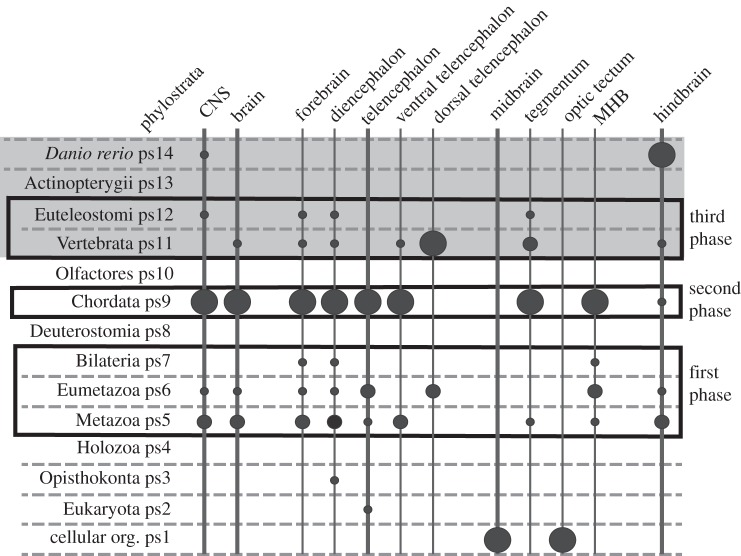
Figure 3.
Summary of a phylostratographic analysis of the zebrafish (Danio rerio) CNS. The phylostrata are at the left. The vertebrate section is shaded grey. The size of the circles is proportional to the number of genes expressed in a given region of the vertebrate brain that first appeared in that phylostratum. Phylostratum 8 (ps8) includes echinoderms and hemichordates. Phylostratum 9 includes cephalochordates (amphioxus), while phylostratum 10 includes tunicates. The largest number of genes expressed in the zebrafish brain first appeared in cephalochordates. Adapted from [1].

