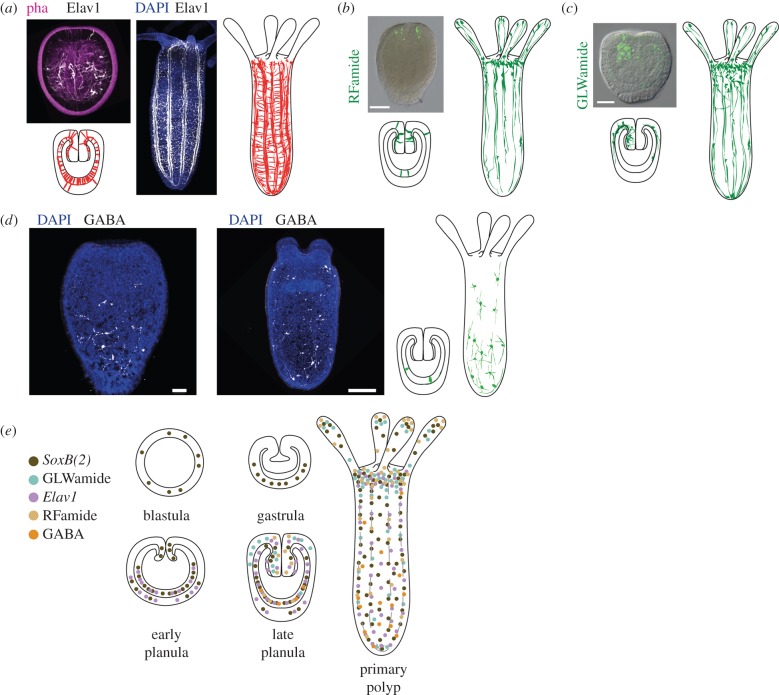
Figure 2.
(a) Distribution of Elav1-positive neurons in planula (left) and primary polyp (right). In the microscopic images (taken from reference [27]), Elav1-positive neurons are in white, phalloiding is in purple, and DAPI is in blue. In the schematic, Elav1-positive neurons are in red. (b) Distribution of RFamide-positive neurons in planula (left) and primary polyp (right). The inset is from reference [28]. RFamide-positive neurons are in green. (c) Distribution of GLWamide-positive neurons in planula (left) and primary polyp (right). The insert is from reference [28]. GLWamide-positive neurons are in green. (d) Distribution of GABA-positive neurons in planula larva and the primary polyp (GABA, white; DAPI, blue). The original data images are maximum projections of 20–30 single confocal images. (e) Distribution of different neuronal subpopulations during the development of N. vectensis. The schematic is based on the results of immunostaining with the antibody against the neuropeptide (GLWamide (turquoise) [28], RFamide (beige) [26,28], GABA (orange) (I.K. and U.T. 2015, unpublished data), or on the analysis of transgenic animals in which a fluorophore is under the control of the gene of interest promoter (SoxB(2) (brown) [29], Elav1 (purple) [27]). Scale bars, (b,c) 100 µm; (d) 50 µm (planula), 100 µm (primary polyp).

