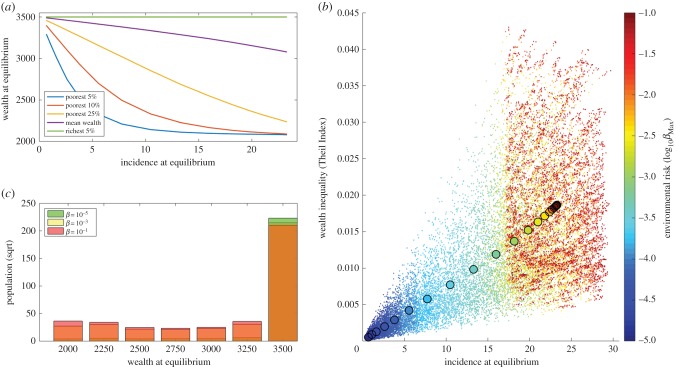
Figure 3.
Impact of Buruli ulcer on economic inequalities. (a) Impact of Buruli ulcer incidence on the mean wealth of different population subgroups. (b) Distribution of wealth at equilibrium in populations under different environmental risks. (c) Link between incidence and wealth inequality at equilibrium for a gradient in environmental risk. The colour changes with the environmental risk, from dark blue at the lowest risk towards dark red at the highest risk. Each dot represents one simulation with parameter values selected through Latin Hypercube sampling, and the larger circles represent the mean value of all 1000 simulations for each βMax.

