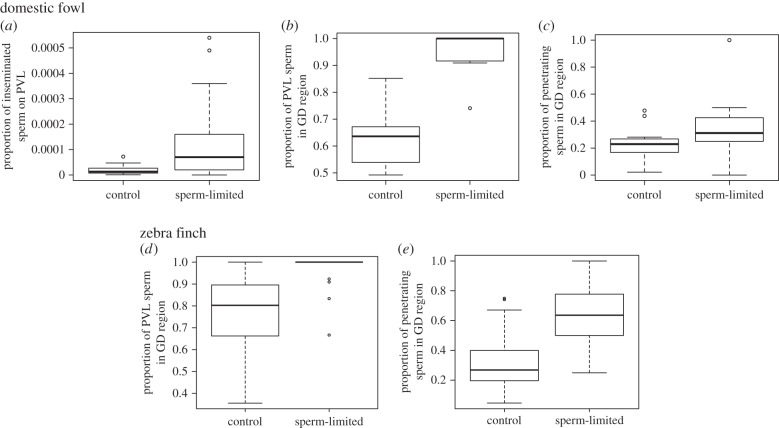
Figure 2.
Tukey box plots show the proportion of (a) inseminated sperm that reached the ova during the first 4 days of egg-laying in the domestic fowl, following control and sperm-limited inseminations (n = 17 eggs in each group, mean proportion of sperm reaching ova = 0.13 × 10⁻³ (L-95% confidence interval (CI) = 0.08 × 10⁻³, U-95% CI = 0.18 × 10⁻³) and 1.19 × 10⁻³ (L-95% CI = 0.50 × 10⁻³, U-95% CI = 1.88 × 10⁻³), based on 10 000 000 and 10 000 inseminated sperm, respectively; z = 27.89; p < 0.0001); PVL, perivitelline layer; (b,d) sperm associated with the ovum that were in the germinal disc (GD) region in the domestic fowl (n = 17 control and 13 sperm-limited eggs; z = 31.54; p < 0.0001) and zebra finch (n = 53 control and 42 sperm-limited eggs; z = 6.99; p < 0.0001), respectively; (c,e) sperm associated with the germinal disc region that penetrated the ovum in the domestic fowl (n = 17 control and 13 sperm-limited eggs; z = 4.052; p < 0.0001) and zebra finch (n = 53 control and 42 sperm-limited eggs; z = 8.893; p < 0.0001), respectively.

