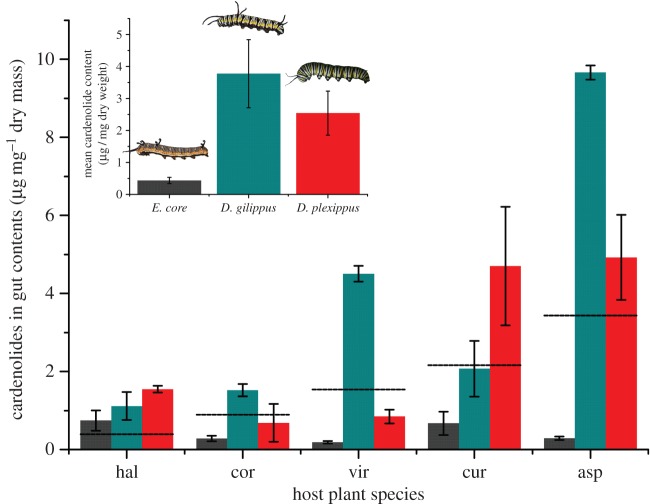
Figure 6.
Cardenolide concentration of caterpillar midgut contents. Grey bars, E. core; blue bars, D. gilippus; red bars, D. plexippus. Dashed horizontal lines indicate mean plant cardenolide concentration. Inset: means ± s.e. of cardenolides of gut contents over five plant species. For quantitative evaluation of cardenolides in the gut contents, we focused on the dominant peaks (see Material and methods, the trend that midgut contents of E. core have cardenolide concentrations below plant material is upheld when all cardenolide peaks detected in E. core are taken into account). (Online version in colour.)

