Figure 2.
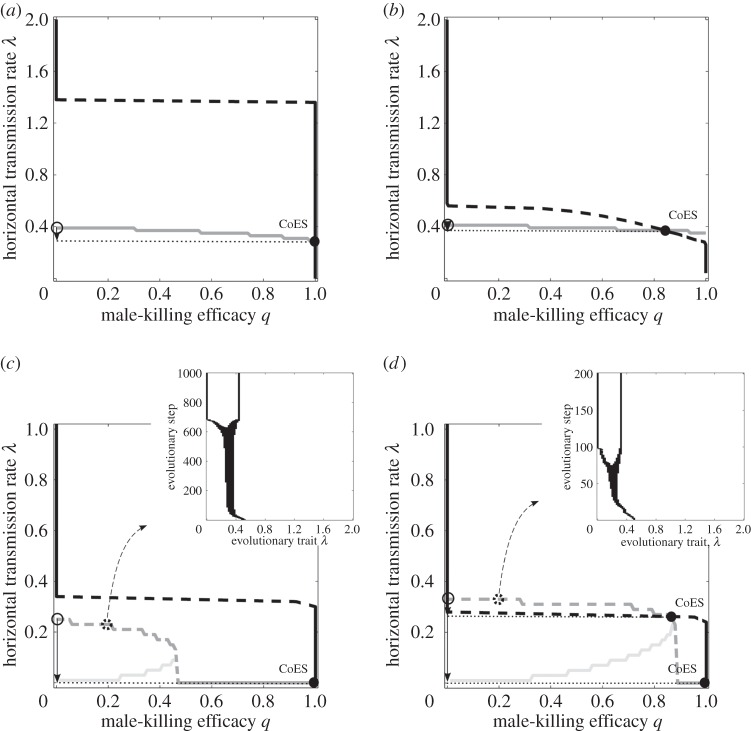
Simultaneous trait evolution when (a–b) the VT efficacy ξ is fixed, and (c–d) the VT efficacy ξ and HT rate λ are linked via the trade-off (2.5). The grey and black curves represent evolutionary singularities (λ* as a function of q and q* as a function of λ, respectively) once the parasite is allowed to kill the infected males. The evolutionary attracting HT rate in the absence of MK (q = 0) is represented by the open circle. The filled circle then represents the coevolutionary singularity (CoES) of the HT rate  and MK efficacy
  The solid arrows in the bottom left corners show the decrease in the HT rate (from λ* to
  ) following coevolution of λ and q. Legend: solid dark grey, attractor
  ; dashed dark grey, branching point
  ; light grey, repellor
  ; solid black, attracting lower
  or upper
  bound; dashed black, branching point
  Parameters: (a) ξ = 0.8, h = 1, (b) ξ = 0.68, h = 0.52, (c) z = 0.75, h = 1 and (d) z = 0.7, h = 1. Common parameters: a1 = 1, a2 = 0.5, c = 3 and μ = b = 0.1.

