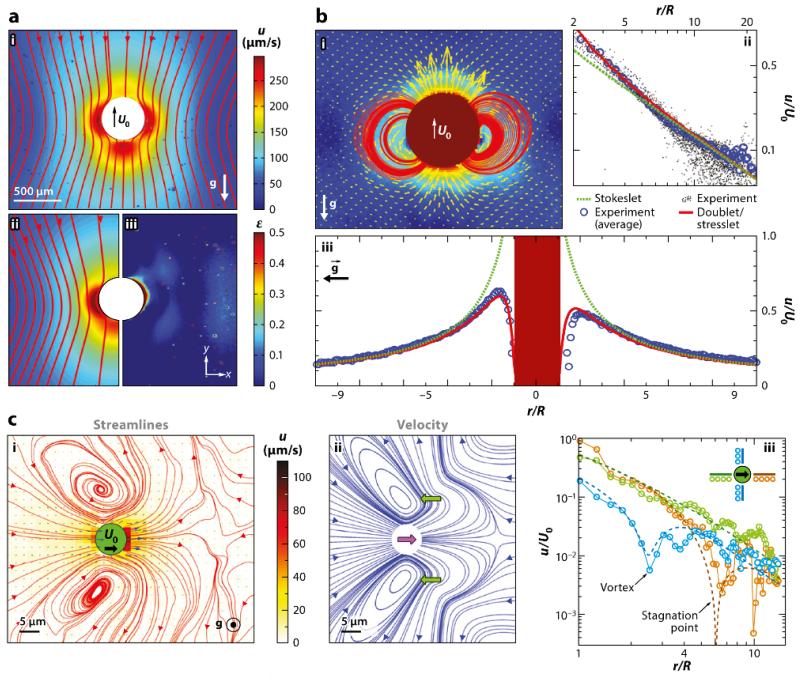
FIG. 4.
Flows around freely swimming green algae. (a) Velocity field around Volvox carteri in the laboratory frame. (i,ii) Magnitude and streamlines of u and theoretical fit, with a common color bar. (iii) The relative error of fit. The direction of gravity is indicated. (b) Near-field flow around V. carteri. (i) Magnitude, vector fields, and streamlines of u after subtracting a fitted Stokeslet, with the color bar as in part i of panel a. (ii) Velocity magnitude taken along a horizontal cross section through the center of a colony. An average Stokeslet (green dashed line) follows the observed decay (blue circles) averaged over the sample set of colonies (black dots). Deviations from a pure Stokeslet appear at distances less than ~ 5R and are accounted for by adding a source doublet and a stresslet (red solid line). (iii) Vertical section of u through the center of a colony, with symbols as in panel ii, showing front-back asymmetry due to the stresslet. (c) Average flow field of Chlamydomonas reinhardtii. (i) Streamlines (red) computed from velocity vectors (blue). Color scheme indicates flow speed magnitudes. (ii) Streamlines of the azimuthally averaged three-Stokeslet model. Flagellar thrust results from two Stokeslets (lateral green arrows), whose sum balances the drag on the cell body (central purple arrow). (iii) Decay of the velocity magnitude for the three directions indicated by separate colors in the inset compared to results from the three-Stokeslet model (dashed lines). Figure adapted with permission from Drescher et al. (2010a). Copyright 2010 by the American Physical Society.

