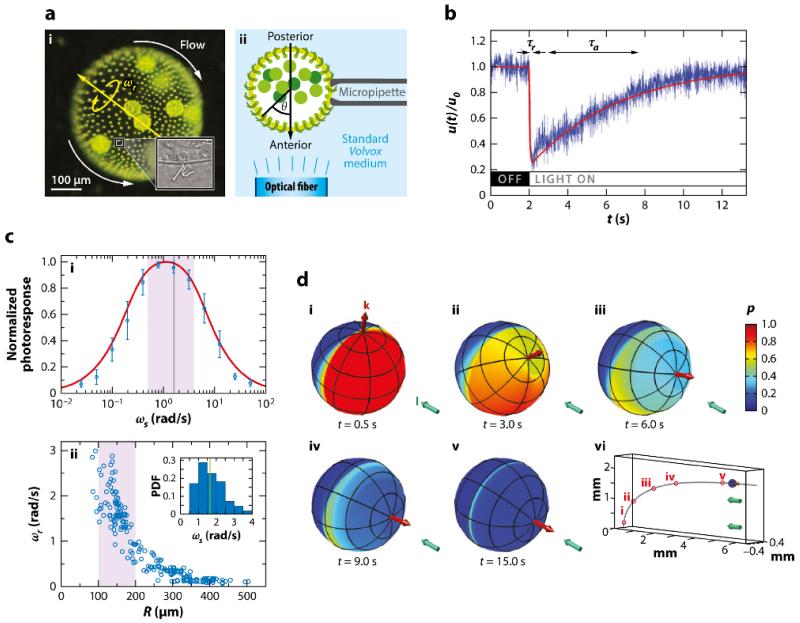
FIG. 8.
Phototaxis in Volvox carteri. (a) Experimental setup. (i) Flows around the colony. (ii) Optical fiber illumination setup. (b) Local flagella-generated fluid speed u(t) (blue), measured with particle image velocimetry just above the flagella during a step-up in light intensity, normalized by the flow speed in the dark. Two timescales are evident: a short response time, τr, and a longer adaptation time, τa. The fitted theoretical curve (red) is from the solution of Equations 10 and 11. (c) Photoresponse frequency dependence and colony rotation. (i) Normalized flagellar photoresponse versus frequencies of sinusoidal stimulation (blue circles). The theoretical response function (red line; Equation 12) shows quantitative agreement. (ii) Colony rotation frequency ωr of V. carteri as a function of radius R. Highly phototactic organisms within the range indicated by the purple shaded region, corresponding to the purple shaded region in part i, demonstrate that response timescales and the colony rotation frequency are mutually optimized to maximize the photoresponse. (d) Colony behavior during a phototurn. (i–v) The colony axis (red arrow) tipping toward the light direction I (aqua arrow). Colors represent the amplitude p(t) of the downregulation of flagellar beating in a model of phototaxis. (vi) The swimming trajectory. Abbreviation: PDF, probability distribution function. Figure adapted with permission from Drescher et al. (2010b). Copyright 2010 by the National Academy of Sciences.

