
Fig. 4.
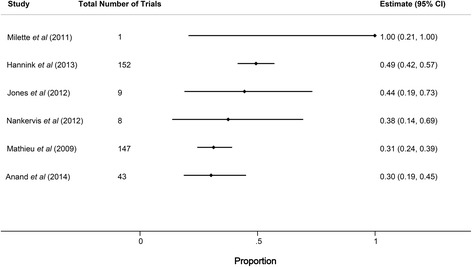
Forest plot showing the proportion of primary outcome discrepancies among prospectively registered trials. Horizontal bars indicate 95 % confidence intervals (CI) for proportions
Official websites use .gov
A
.gov website belongs to an official
government organization in the United States.
Secure .gov websites use HTTPS
A lock (
) or https:// means you've safely
connected to the .gov website. Share sensitive
information only on official, secure websites.
Forest plot showing the proportion of primary outcome discrepancies among prospectively registered trials. Horizontal bars indicate 95 % confidence intervals (CI) for proportions