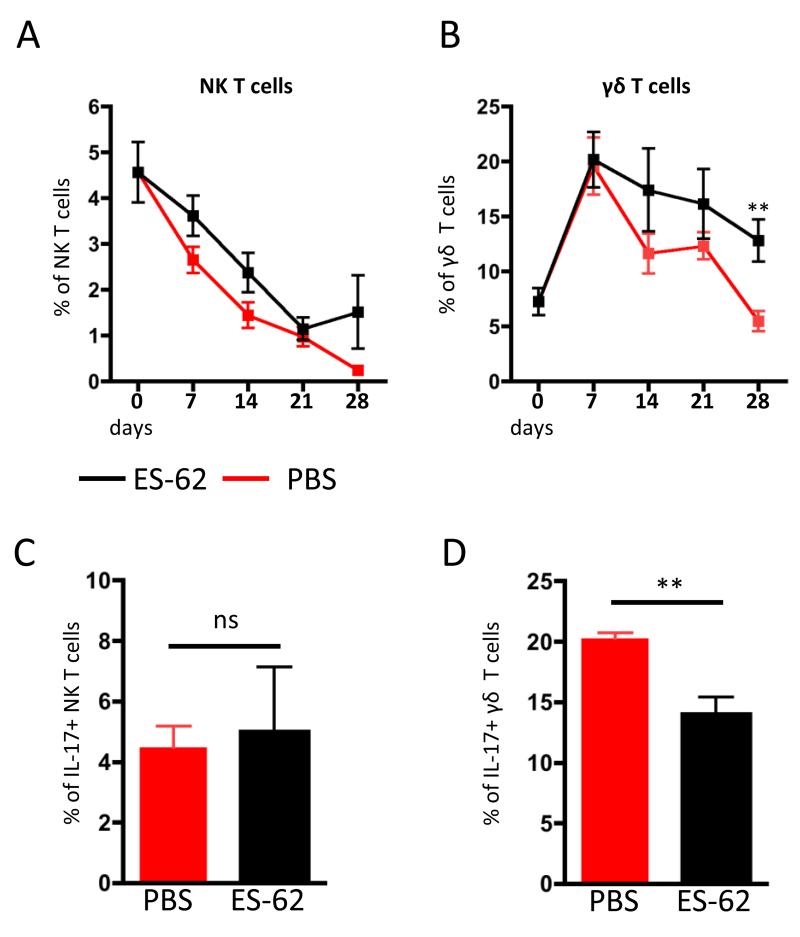
Figure 1. Kinetic analysis of IL-22-producing NK and γδ T cells in DLN of mice with CIA.
ES-62- and PBS-treated mice undergoing CIA were culled every 7 days (n=4 for each treatment group at each time-point) and IL-22 expression by DLN cells analysed by intracellular flow cytometry. Proportions of spontaneously IL-22-producing, CD49b+ NK T cells (A) and γδ+ TCR+ T cells (B) from individual mice were evaluated as described in the Material and Methods. The proportions of IL-17-producing NK (C) and γδ T cells (D) were also analysed at d28. Red symbols represent CIA mice treated with PBS whilst black symbols represent mice treated with ES-62. Values are the mean ± SEM of 4 individual mice at each time. *p<0.05, **p<0.01.

