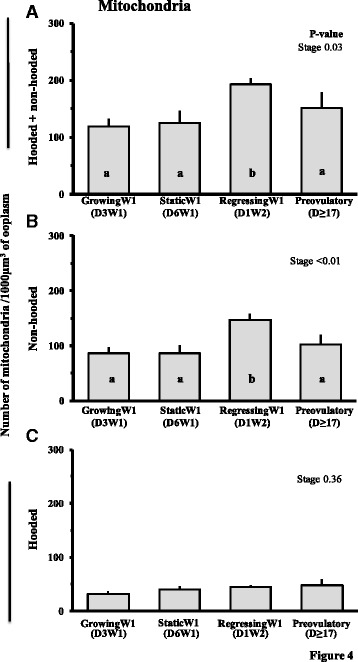
Fig. 4.

Number (Mean ± SE) of total (non-hooded and hooded combined) (a), non-hooded (b) and hooded (c) mitochondria per 1000 μm3 of oocyte from follicles at different stages of follicular growth and maturation: Day 3 of Wave 1 (D3W1), Day 6 of Wave 1 (D6W1), Day 1 of Wave 2 (D1W2) and preovulatory during estrus (Day ≥17). abValues with no common letters are different (P < 0.05)
