
Fig. 3.
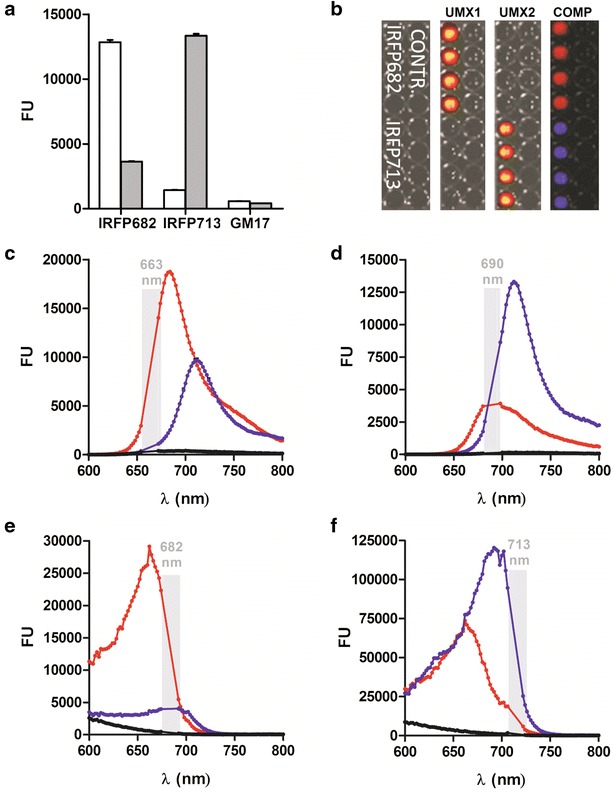
Evaluation of the expression of IRFP682 and IRFP713 in L. lactis. a Fluorescence intensity of L. lactis expressing IRFP682, IRFP713 and growth medium (GM17) determined at excitation/emission wavelengths 663/682 nm (white) or 690/713 nm (gray). b Distinction of IRFP682 and IRFP713-expressing lactococci, dispensed in microtiter plates, with IVIS Spectrum and spectral unmixing (Contr. empty vehicle control, UMX1 IRFP682 fluorescence, UMX2 IRF713 fluorescence, COMP. composite image). Emission (c, d) and excitation (e, f) spectra of IRFP682-expressing L. lactis (red), IRFP713-expressing L. lactis (blue) and control L. lactis (black), recorded at wavelengths specified in gray. Gray belts denote excitation and emission wavelengths at which reliable read-outs could not be obtained due to the vicinity of the wavelength used to record the spectrum