
Fig. 5.
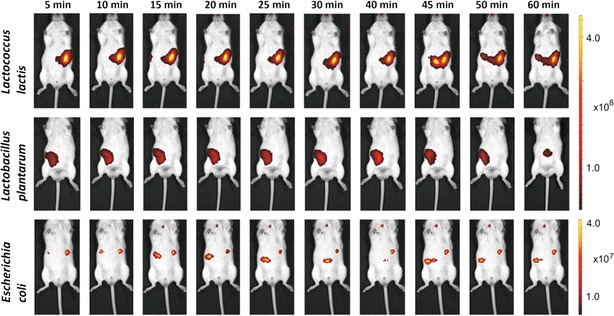
Representative time-course (1 h) imaging of mice receiving 5.0 × 10¹⁰ cells of IRFP713-expressing L. lactis (upper row), Lb. plantarum (middle row) and E. coli (bottom row). Color bars indicate radiant efficiency [(p/s/cm2/sr)/(μW/cm2)]
Official websites use .gov
A
.gov website belongs to an official
government organization in the United States.
Secure .gov websites use HTTPS
A lock (
) or https:// means you've safely
connected to the .gov website. Share sensitive
information only on official, secure websites.
Representative time-course (1 h) imaging of mice receiving 5.0 × 10¹⁰ cells of IRFP713-expressing L. lactis (upper row), Lb. plantarum (middle row) and E. coli (bottom row). Color bars indicate radiant efficiency [(p/s/cm2/sr)/(μW/cm2)]