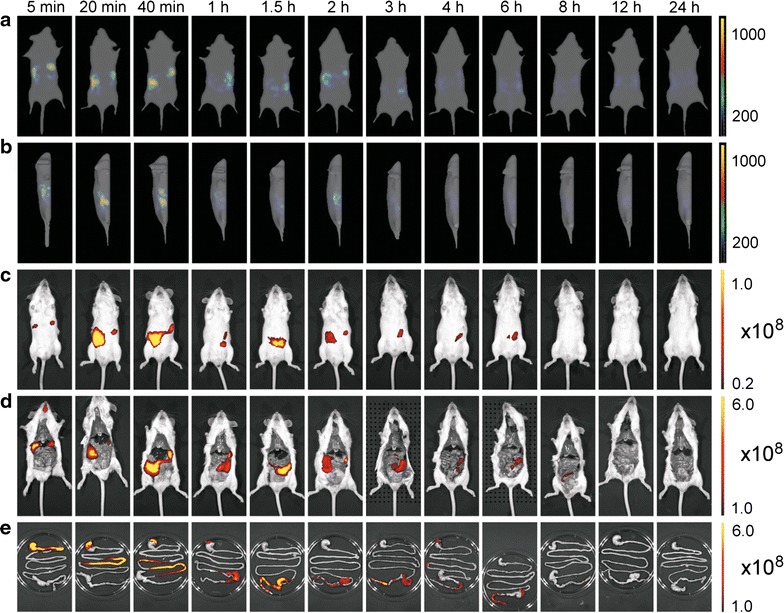
Fig. 8.

Imaging of mice at different time points after administration with 5.0 × 10¹⁰ cells of IRFP713-expressing L. lactis. Whole-body imaging was performed using trans-illumination and fluorescence imaging tomography (FLIT; a on the back, b on the side); or c epifluorescence. Ex vivo epifluorescence imaging was performed on dissected animals (d) or isolated intestines (e). Color bars indicate radiant efficiency [(p/s/cm2/sr)/(μW/cm2); epifluorescence] or total fluorescence yield (pmol/M cm; FLIT)
