
Fig. 2.
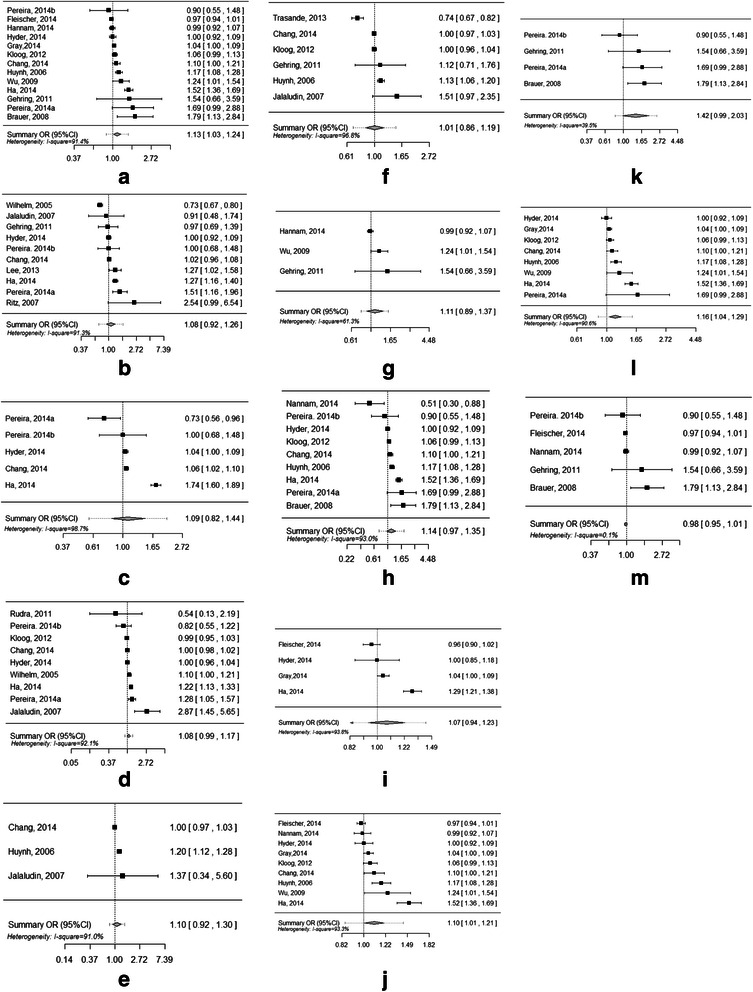
Forest plots for the pooled ORs for the association between PM2.5 exposure (per 10 μg/m3 increment) during the pregnancy and preterm birth. a: In studies that assessed PM2.5 exposure during the entire pregnancy. b: In studies that assessed PM2.5 exposure in the first trimester. c: In studies that assessed PM2.5 exposure in the second trimester. d: In studies that assessed PM2.5 exposure in the third trimester. e: In studies that assessed PM2.5 exposure in the first month of gestation. f: In studies that assessed PM2.5 exposure within one month before birth. g: In studies that assessed PM2.5 exposure at individual level. h: In studies that assessed PM2.5 exposure at semi-individual level. i: In studies that assessed PM2.5 exposure at regional level. j: In retrospective studies. k: In prospective studies. l: In studies conducted in the USA. m: In studies conducted in other countries