
Fig. 3.
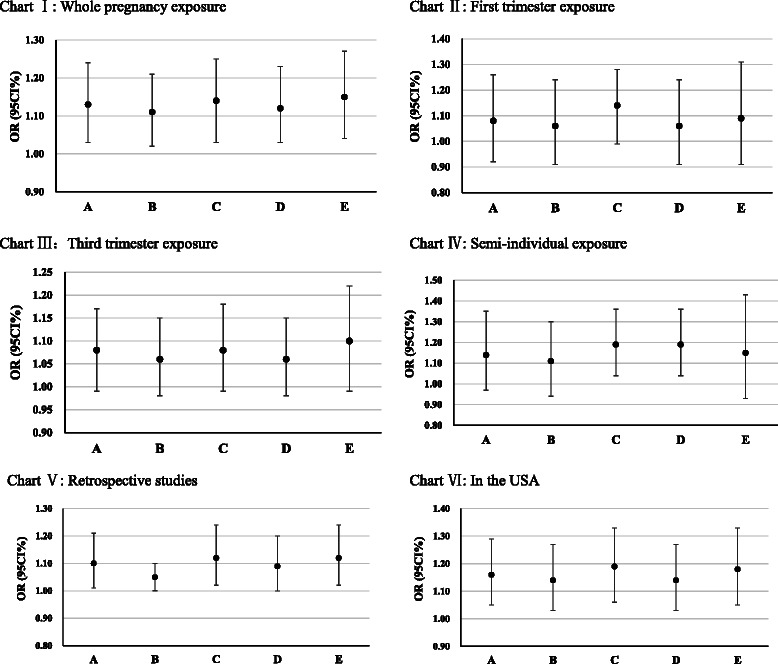
Sensitivity analysis for the pooled effects of PM2.5 exposure (per 10 μg/m3 increment) on preterm birth risk in different subgroups. a: All studies were included; b: The study with the largest effect size was excluded; c: The study with the smallest effect size was excluded; d: The study with the largest standard error was excluded; e: The study with the smallest standard error was excluded. Chart I: In studies that assessed the association between PM2.5 exposure during the entire pregnancy and preterm birth. Chart II: In studies that assessed the association between PM2.5 exposure in the first trimester and preterm birth. Chart III: In studies that assessed the association between PM2.5 exposure in the third trimester and preterm birth. Chart IV: In studies that assessed the PM2.5 exposure at the semi-individual level. Chart V: In retrospective studies. Chart VI: In studies that were conducted in the USA