
Fig. 4.
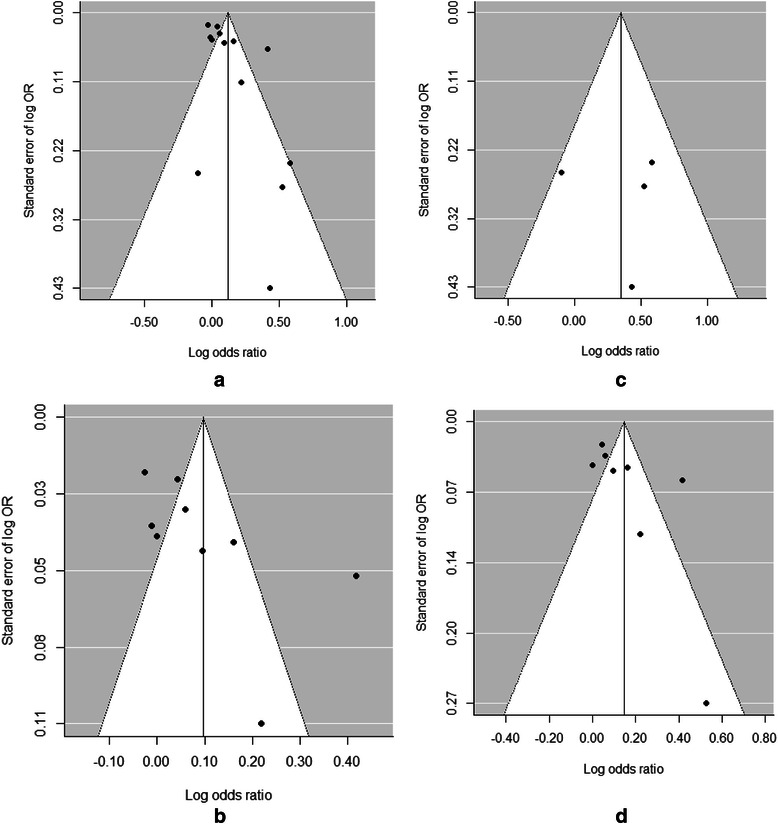
Funnel plots for the meta-analyses assessing the associations between PM2.5 exposure (per 10 μg/m3 increment) during pregnancy and preterm birth. a: In studies that assessed PM2.5 exposure during the entire pregnancy. b: In retrospective studies. c: In prospective studies. d: In studies conducted in the USA