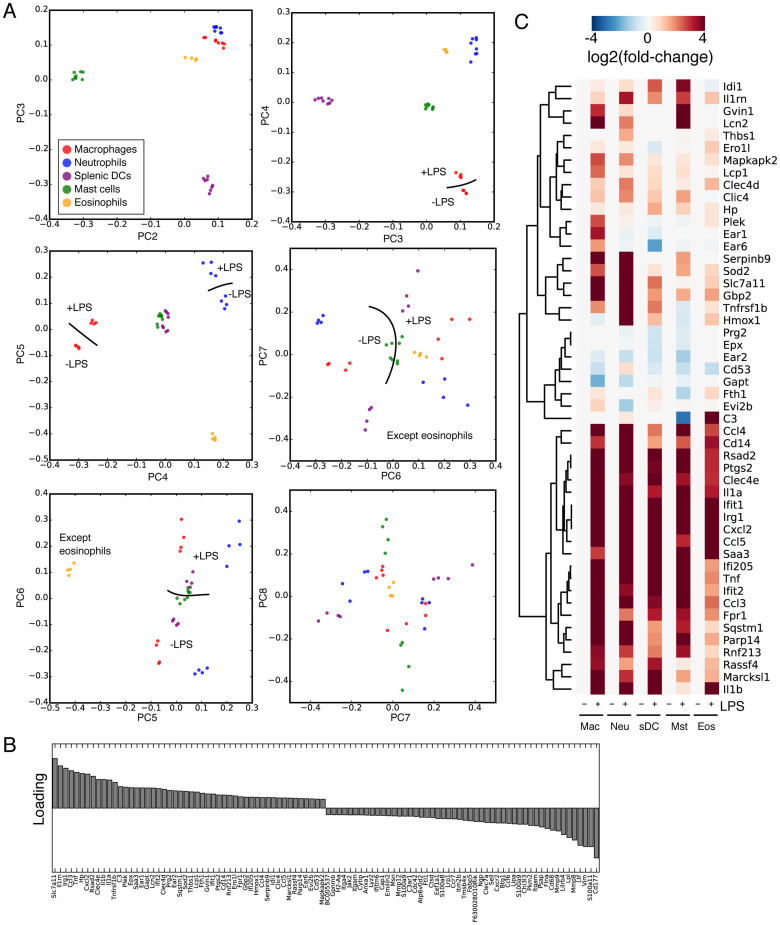
Figure 2. Principal componenet analysis of changes in myeloid gene expression.
(A) Principal component (PC) analysis of the myeloid cells assayed in this study. PCs 2 through 7 are indicated, cell types are colored according to the key and where appropriate samples that segregate with and without LPS are indicated with a line showing the separation and ‘+LPS' and ‘-LPS' for the appropriate treatment. At no PC could we detect a gradient that corresponded to IL-10 treatment. (B) Loading for PC6, which correlates with LPS treatment. (C) Heatmap of the fold-change expression changes of the top 50 genes at the top of PC6.

