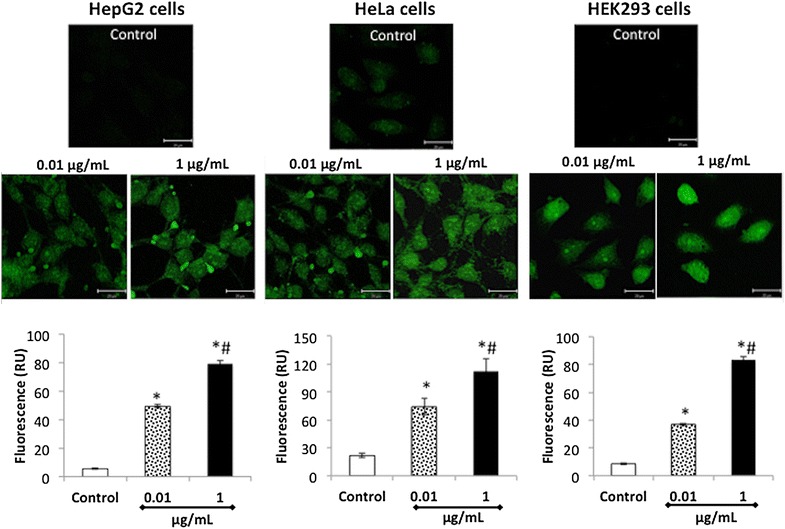
Fig. 4.

Fluorescent microscopic visualization and quantitation of CdS-Dx/QDs in human cell lines. Cells were incubated for 24 h with CdS-Dx/QDs (0.01 and 1 μg/mL), after which the free QDs were washed away, fixed in coverslips, and analyzed with a confocal microscope. Fluorescence images (green) showing cellular uptake of QDs in the cytoplasm of HepG2 and HeLa cells, and in the nucleus of HEK293 cells. Scale bar 20 μm. To measure the cellular uptake of CdS-Dx/QDs, cells were incubated with QDs (0.01 and 1 μg/mL) for 24 h. After this, the free QDs were washed away and the cells fixed. Cells were observed under fluorescence microscopy and analyzed using Image-Pro Insight 9 software. Data are presented as the mean ± SD of at least three independent experiments. *p< 0.05 as compared with control group. #p < 0.05 as compared with 0.01 μg/mL
