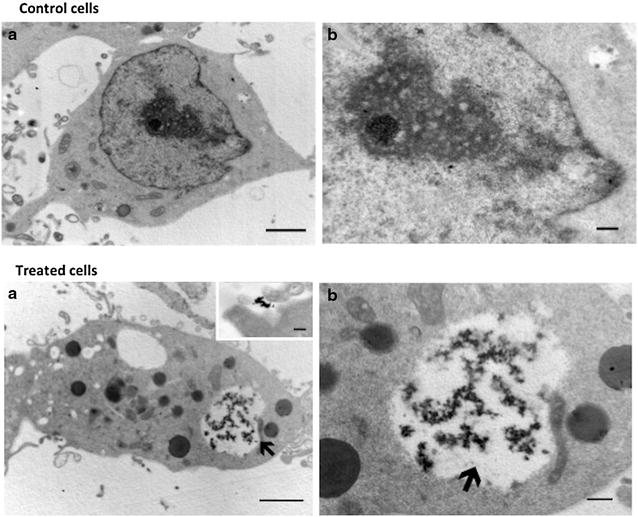
Fig. 6.

Intracellular location of the NPs Cds particles in HEK293 cells. Control cells. a Correspond a low magnification micrograph of a HEK293Q cells with its typical ameboid shape. b Correspond to high magnifications of cells. Scale bar in A = 1 μm; B = 200 nm. Treated cells. a Micrographs of HEK293 Q cells incubated with CdS-Dx/QDs. b Corresponds a magnifications of micrograph a. Inset in a correspond to the presence of the particles near to filopodial from a different cell. Scale bar in A = 1 μm; in B = 200 nm and in the inset in A = 100 nm
