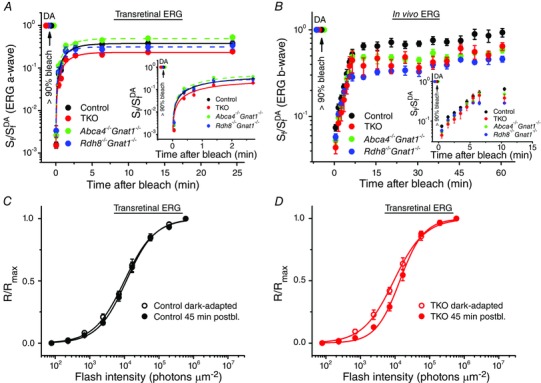
Figure 4. M‐cone dark adaptation in the absence of RDH8 and/or ABCA4 in 2‐month‐old mice .

A, recovery of cone a‐wave flash sensitivity (S f) in isolated retinas of control (n = 7), Abca4−/−Gnat1−/− (n = 8), Rdh8−/−Gnat1−/− (n = 6) and TKO (n = 14) mice after bleaching >90% of cone pigment at time 0 with 505 nm LED light. Data were fitted with single‐exponential functions for better visualization of the relative cone sensitivity recovery. S f DA denotes the sensitivity of dark‐adapted cones. The inset shows the initial S f recovery on expanded time scale. B, recovery of photopic ERG b‐wave S f in vivo in control (n = 4), Abca4−/−Gnat1−/− (n = 6), Rdh8−/−Gnat1−/− (n = 6) and TKO (n = 3) mice after bleaching >90% of cone pigment at time 0 with 520 nm LED light. S f DA designates the sensitivity of dark‐adapted cones. The inset shows the initial S f recovery on expanded time scale. C, normalized averaged cone intensity–response relationships of isolated retinas from control mice. Live animals were either dark‐adapted or illuminated with 30 s 520 nm LED light bleaching >90% of M‐cone pigment and kept in the dark for 45 min, prior to ex vivo ERG recordings. Data points were fitted with Naka–Rushton hyperbolic functions. The average cone sensitivities (S f) were 0.21 (dark‐adapted, n = 5) and 0.16 (45 min postbleach (postbl.), n = 10). D, normalized averaged cone intensity–response functions of isolated retinas from TKO mice. The experimental protocol was the same as in C. The average cone sensitivities (S f) were 0.23 (dark‐adapted, n = 5) and 0.13 (45 min postbleach, n = 9), respectively. Error bars represent SEMs (smaller than the symbol size for some data points).
