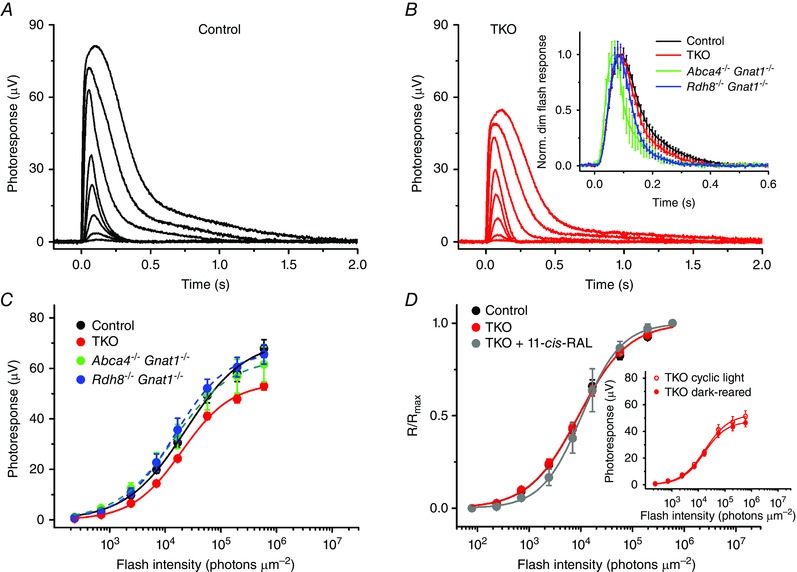
Figure 9. Sensitivity (I1/2) and kinetics of M‐cone photoresponses in mouse lines lacking RDH8 and/or ABCA4 .

Representative families of M‐cone transretinal ERG responses from 2‐month‐old control (A) and TKO (B) animals. Flash strengths were increased from 2.4 × 10² to 6.0 × 10⁵ photons μm−2 by steps of ∼0.5 log units (505 nm light). The inset in B shows population‐averaged normalized cone responses to test stimuli of 2.4 × 10³ photons μm−2 in the four mouse lines. Error bars represent SEMs. C, averaged intensity–response functions of isolated control (n = 15), TKO (n = 15), Abca4−/−Gnat1−/− (n = 10) and Rdh8−/−Gnat1−/− (n = 12) retinas. Points were fitted with Naka–Rushton hyperbolic functions (see Methods). Error bars represent SEMs. D, normalized averaged cone intensity–response relationships of isolated retinas from control (I 1/2 = 9.1 × 10³ photons μm−2, n = 8) and TKO (I 1/2 = 9.0 × 10³ photons μm−2, n = 13) mice. Also shown (in grey) is the intensity–response relationship for TKO retinas exogenously treated with 130 μm 11‐cis‐retinal (11‐cis‐RAL) (1 h, at RT) prior to the recordings (I 1/2 = 10.0 × 10³ photons μm−2, n = 5). Inset, averaged intensity–response functions of isolated retinas from cyclic light‐reared (n = 10) or dark‐reared (n = 11) 2‐month‐old TKO mice. Points were fitted with Naka–Rushton hyperbolic functions. Error bars indicate SEMs.
