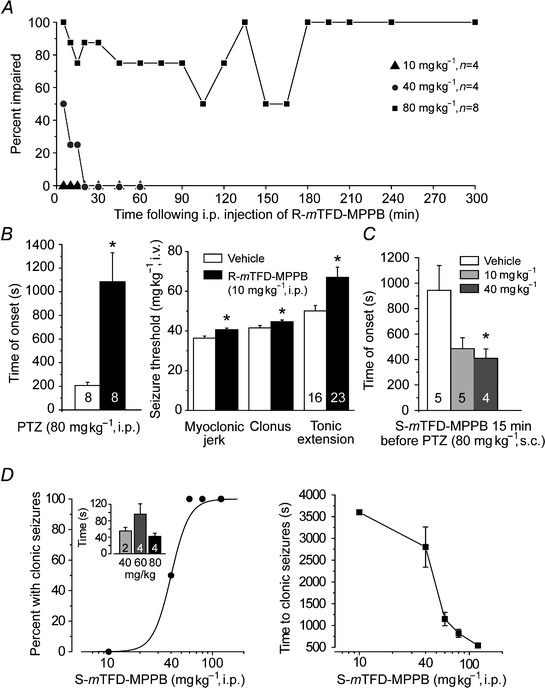
Figure 2. In mice, S‐mTFD‐MPPB is convulsant whereas R‐mTFD‐MPPB is sedative and anticonvulsant .

A, time course for motor impairment in the horizontal screen test following injection with various doses of R‐mTFD‐MPPB. Data points represent per cent of animals exhibiting motor impairment at the specified time; n is the number of mice. B (left), delay in the onset of PTZ‐induced tonic seizures by R‐m‐TFD‐MPPB pretreatment indicating an anticonvulsant action. Open bar represents mean ± SEM time to onset in vehicle group (100% DMSO i.p. 5 min before 80 mg kg−1 PTZi.p.); filled bar represents group pretreated with 10 mg kg−1 R‐mTFD‐MPPB. *P = 0.0032 vs. vehicle. Numbers on bars are the total number of mice in group. B (right), mean ± SEM thresholds for various seizure signs in PTZ infusion test. PTZ infusion (10 mg ml−1 at a rate of 0.5 ml min−1) was begun 5 min after i.p. injection of vehicle with or without 10 mg kg−1 R‐mTFD‐MPPB. *P < 0.05. A reduction in seizure threshold was not observed indicating a lack of proconvulsant activity. C, S‐mTFD‐MPPB reduces the time to onset of tonic seizures induced by PTZ. S‐mTFD‐MPPB was administered i.p. 15 min before 80 mg kg−1 s.c. PTZ. Note that the time to onset with s.c. PTZ is substantially longer than with i.p. PTZ (B, left), P = 0.037 by one‐way ANOVA. *P < 0.05 by Tukey HSD test. D (left),dose–response relationship for S‐mTFD‐MPPB's induction of clonic seizures. Points indicate percent of animals exhibiting clonic seizures; four animals were tested at each dose. The sigmoidal curve is a logistic fit by eye. The CD50 is 40 mg kg−1. The inset shows the mean ± SEM seizure duration at the indicated doses; the number of animals is indicated by numerals in bars. D (right), time to onset of clonic seizure for the experiment of D (left); the value for the 10 mg kg−1 group represents the duration of the observation period because no seizures were observed.
