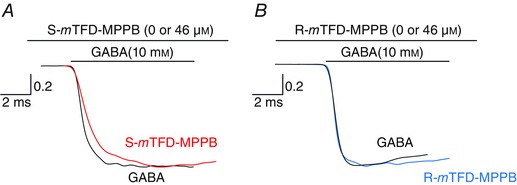
Figure 9. S‐mTFD‐MPPB decreases the activation rate of GABAARs whereas R‐mTFD‐MPPB does not .

Rising phases from Fig. 8 B are shown on an expanded scale and normalized to their own maximum to aid comparison of the slopes. The first 30 ms of 10 mm GABA traces are shown with the same colour scheme as Fig. 8. All curves could be fitted to a single exponential and the mean rates ± SD for 10 mm GABA are given in the text.
