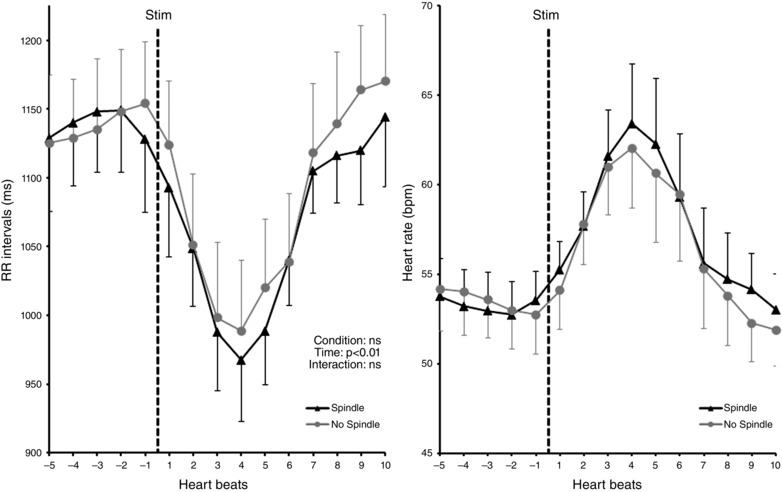
Figure 3. Autonomic responses (mean ± SEM) to laser nociceptive stimuli delivered during (black) and apart from (grey) sleep spindles .

Left: cardiac R‐R interval evolution preceding and following nociceptive stimuli. Statistical analysis was performed on these data. Right: representation of the same data in heart rate (bpm). Nociceptive stimuli induced a similar R‐R interval decrease (i.e. heart rate increase) in both conditions.
