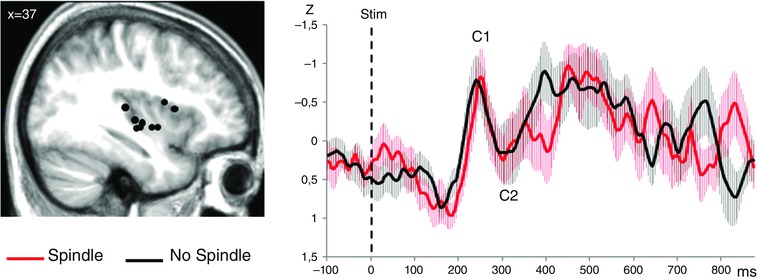
Figure 5. Grand‐averages of LEPs (n = 9 patients) recorded within the insular cortex (referential mode) according to stimulus condition .

Left: anatomical sites of contacts in the insula (black dots) on a sagittal view of the mean MNI normalized MRI of the nine patients (MNI co‐ordinate x = 37). Right: LEPs recorded from the insular cortex. The light area surrounding each trace represents the SEM. All the traces have been latency‐normalized according to the C1 peak and amplitude‐normalized using the standard score unit (Z‐score). The amplitude of the C1–C2 response did not differ between the Spindle and No Spindle conditions.
