Figure 3.
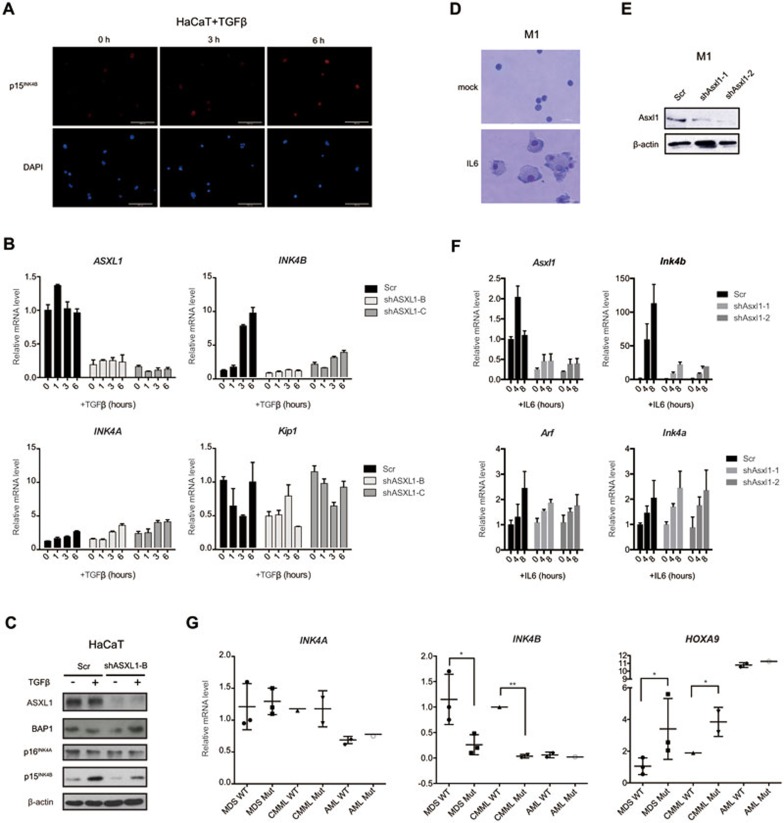
Loss of ASXL1 attenuates extrinsic signal-induced p15INK4B expression. (A) Immunofluorescence staining of p15INK4B in HaCaT cells at the indicated times following TGFβ treatment. Scale bar, 30 μm. (B) Real-time qPCR analyses to determine the relative mRNA levels of ASXL1, INK4B, INK4A and ARF in control (Scr) or ASXL1-depleted (shASXL1-B and shASXL1-C) HaCaT cells at different times of TGFβ treatment. The error bars denote SD, n = 3. (C) Western blot analysis of ASXL1, ASXL1p16INK4A and p15INK4B in control (Scr) or ASXL1-depleted (shASXL1-B) HaCaT cells with or without 24 h of TGFβ treatment. β-actin served as a loading control for total protein. (D) Wright-Giemsa staining shows the morphology of control (mock) or IL6-treated M1 cells. Scale bar, 30 μm. (E) Western blot analysis of protein lysates prepared from M1 cells expressing two different shRNAs (shAsxl1-1, shAsxl1-2) and scrambled control (Scr). β-actin served as a loading control for total protein. (F) Real-time qPCR analyses of the relative mRNA levels of Asxl1, Ink4b, Arf and p16Ink4a in control (Scr) and Asxl1-depleted (shAsxl1-1 and -2) M1 cells at different times of IL6 treatment. The error bars denote SD, n = 2. (G) Primary bone marrow cells from patients diagnosed with MDS, CMML or AML were harvested for RNA extraction followed by RT-qPCR analyses of expression levels of INK4A, INK4B and HOXA9. The bar in the middle of each group represents the median. P-values were calculated using the two-tailed Student's t-test.

