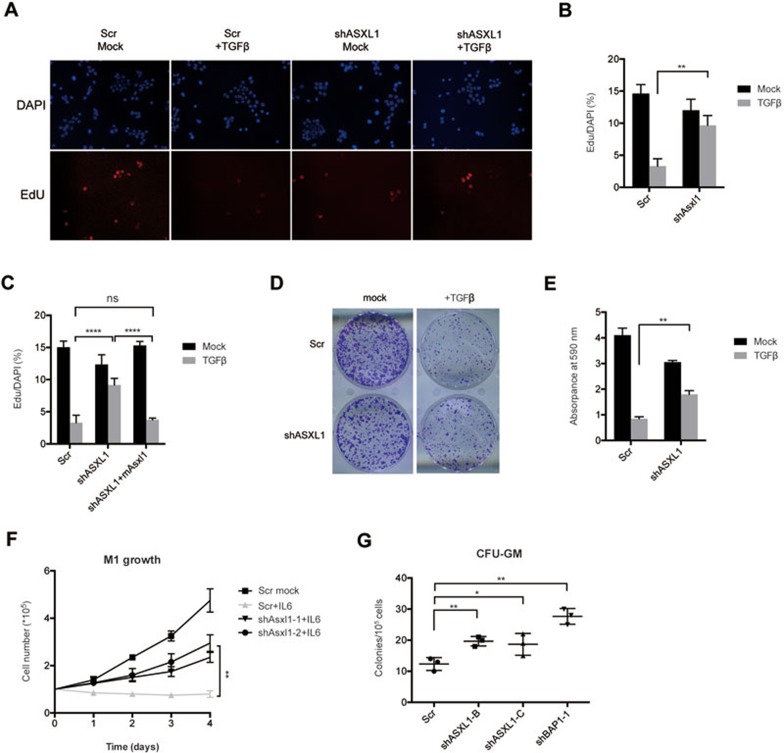
Figure 5.
Decreased expression of ASXL1 confers context-dependent cell growth advantages. (A) HaCaT cells expressing the indicated shRNAs were grown with or without TGFβ for 14 h, and stained for incorporation of EdU and DNA content (DAPI). The data represents one of triplicate experiments. (B, C) Quantification and statistical analysis of the fraction of EdU-positive HaCaT cells (EdU/DAPI). The absolute number of EdU-positive cells and total number of cells were counted for each group. The error bars denote SD, n = 3. (D) Colony formation assay of HaCaT cells treated as indicated. 1 000 cells of each group were seeded into one well of a six-well plate. Fresh medium was replaced every other day with or without TGFβ. After 10 days of culture, cells were washed twice with PBS and stained with crystal violet. One of the triplicate assays is shown. (E) Quantification of cell numbers of the experiment shown in D for the indicated groups of HaCaT cells. Quantifications were done as described in Materials and Methods. (F) Cell growth curves of M1 cells grown with or without IL6 and expressing the indicated shRNAs. Fresh medium was added every other day. Y-axis values represent cell numbers. The error bars denote SD, n = 2. (G) Colony formation in methylcellulose from control (Scr), ASXL1-depleted (shASXL1-B and shASXL1-C) or BAP1-depleted (shBAP1-1) primary bone marrow cells isolated from MDS patients with WT-ASXL1. CFU-GM was classified according to standard morphologic criteria. Data represent the counts of colonies from three independent experiments. Statistical significance was determined by the two-tailed Student's t-test.

