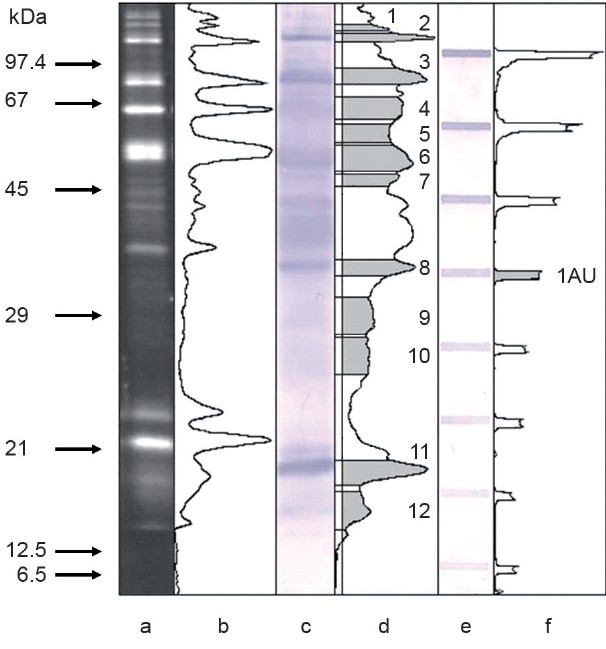
Figure 1.

Electrophoretic analysis of seminal plasma glycoproteins. (a) SyproRuby stained gel, 1.5 μg of protein. (b) Densitometric profile of gel lane a. (c) Aleuria aurantia probed blot, 2.5 μg of protein. (d) Densitometric profile of lane c, background line and the area of measured bands are indicated. (e) Slot-blot of pooled seminal plasma sample probed with a. aurantia lectin. (f) Densitometric profile of lane e, the band considered as lectin reactivity equal to 1 arbitrary unit is indicated. Arrows on the left indicate molar mass calibrators.
