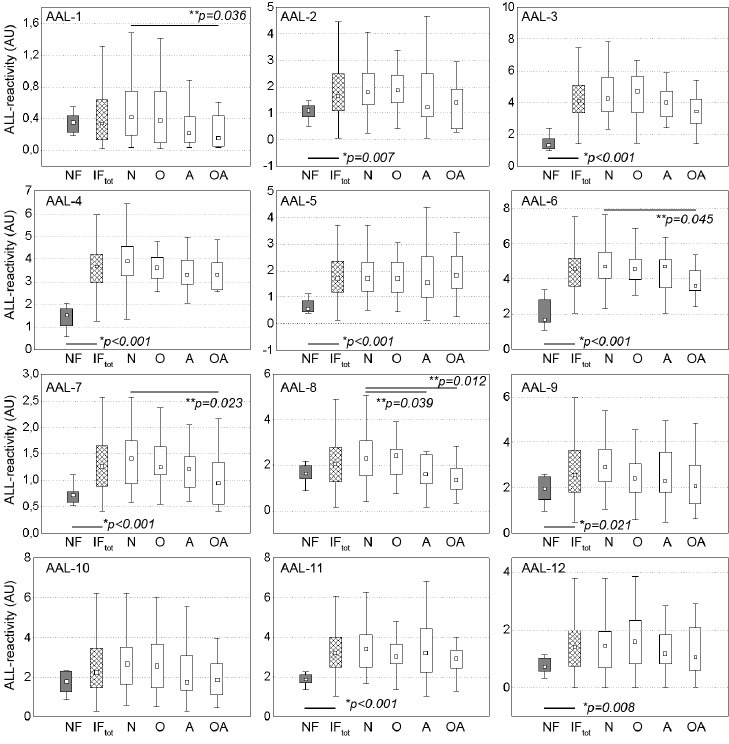
Figure 2.

Lectin reactivity of seminal plasma glycoprotein bands. F: normozoospermic fertile; IFtot: infertile/subfertile, whole group, subgroups; N: normozoospermic; O: oligozoospermic; A: asthenozoospermic; OA: oligoasthenozoospermic. ■ : median; boxes: 25%–75% quartiles, whiskers: nonoutliers, *Statistical significance of the difference between fertile and subfertile groups, calculated with Mann–Whitney U-test; **Statistical significance of the difference among subgroups of subfertile subjects, calculated with Kruskal–Wallis ANOVA test.
