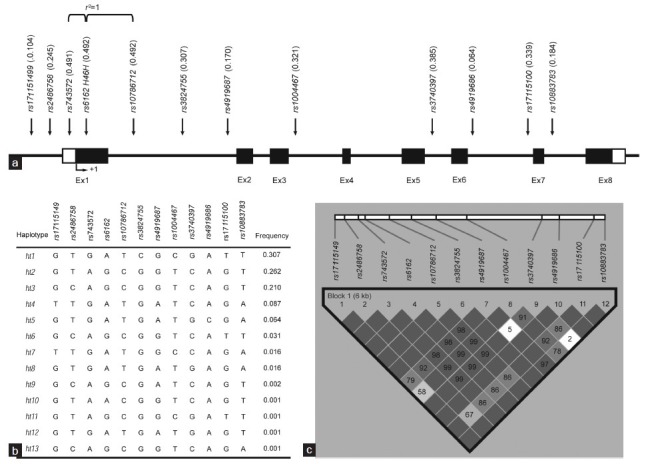
Figure 1.

Gene map, haplotypes, and linkage disequilibrium (LD) coefficients of the CYP17A1 polymorphisms (a) Coding exons (Ex) are marked by black blocks, and 50- and 30-UTRs are marked by white blocks. (b) Haplotypes of CYP17A1. (c) LD coefficients (|D”| and r2) among the CYP17A1 polymorphisms.
