


Figure 2.
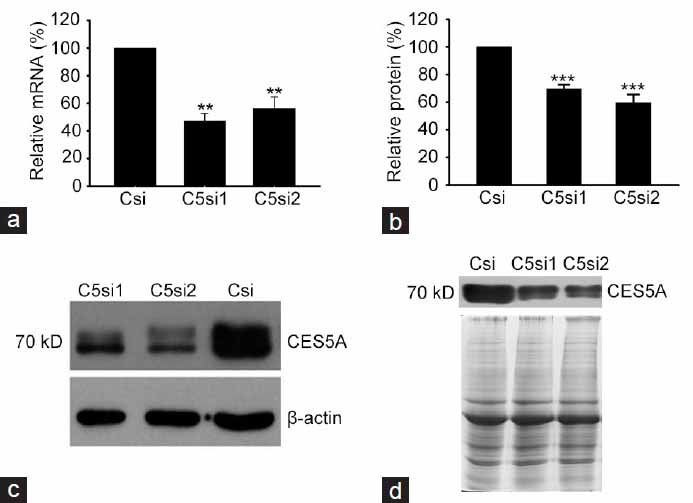
Establishment of a Ces5a knockdown rat model. (a) Expression of Cea5a in cauda epididymidal tissue of the rat at the mRNA level. (b) Expression of CES5A in cauda epididymidal tissue of the rat at the protein level. Densitometry of CES5A and its corresponding β-actin band were performed by Multi Gauge (Fujifilm, version 3.0). The densitometry ratio of CES5A to ACTIN was calculated, and this ratio was calibrated to the nontreated sample to provide the relative protein (%). (c) Detection of CES5A protein in the cauda epididymidis by western blotting. β-actin was used as loading control. The western blot is a representative of 5 independent experiments. (d) Detection of secreted CES5A protein in the cauda lumen by western blotting. Coomassie blue staining was used as internal control. Ten microgramme of total protein were loaded to sodium dodecyl sulfate polyacrylamide gel electrophoresis. In (a–c) : Csi, EGFP siRNA control; C5si1 and C5si2, two siRNAs specifically targeting the different sites of Ces5a sequence. Results represent the means ± standard error of mean of 5–7 independent experiments and were analyzed by one-way analysis of variance and subsequently by the Tukey post hoc test (SigmaPlot version 12.3 software; Systat Software, Richmond, CA, USA). **P < 0.01; ***P < 0.001 compared with the respective Csi group.