
Fig. 2.
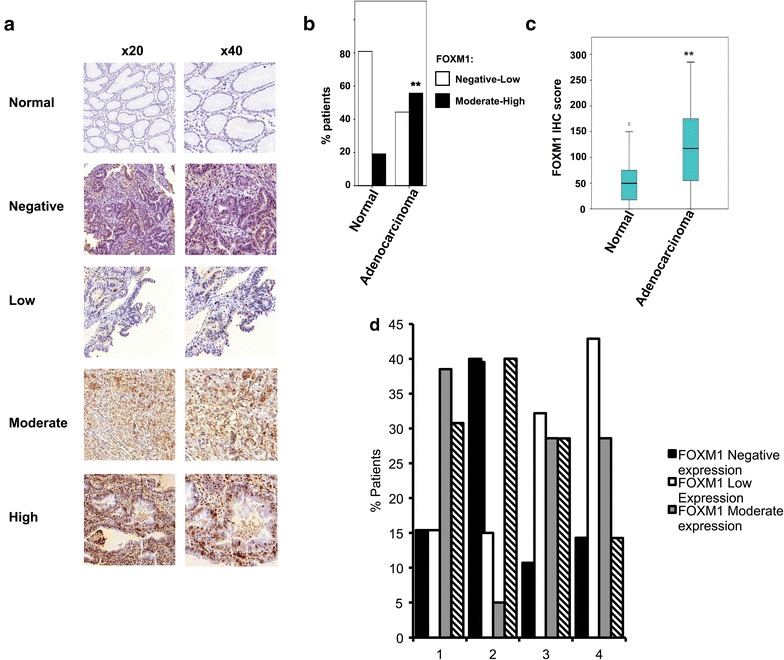
FOXM1 protein expression in gastric tissue assessed by immunohistochemistry. a Tissue microarrays stained by FOXM1 antibody showing normal epithelium, negative, low, moderate and high staining of gastric adenocarcinoma at ×20 and ×40. b The proportion of patients in each category with negative-low FOXM1 staining (white bar) and moderate-high FOXM1 staining (black bar) is shown. c Boxplot of FOXM1 protein expression in gastric tissue. Median values of FOXM1 expression are indicated for each tissue type (indicated by horizontal bar). **P value <0.01. d The histogram demonstrates FOXM1 expression (grouped as negative, low, moderate or high) in relation to AJCC stage as assessed by immunohistochemistry