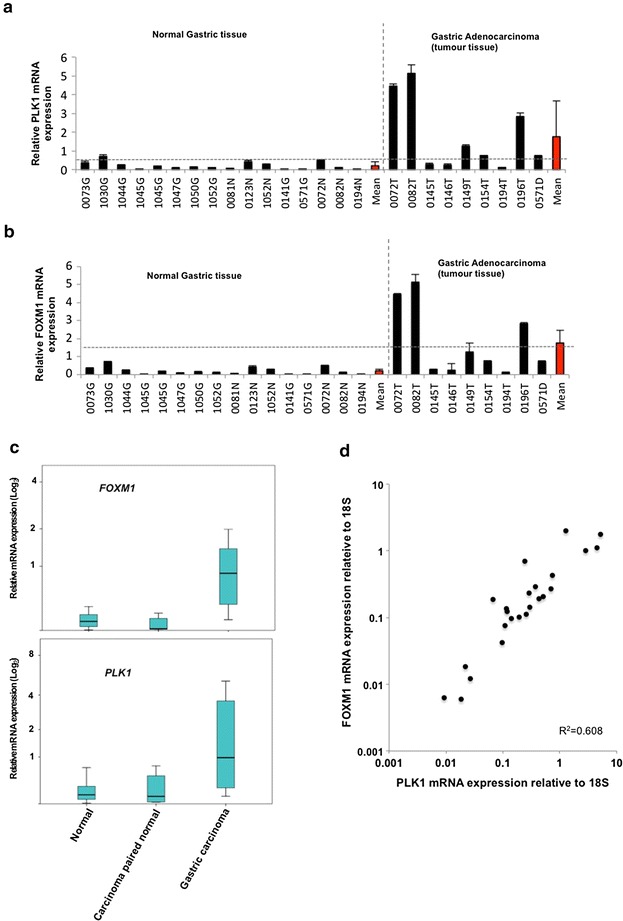
Fig. 3.

PLK1 and FOXM1 expression in normal gastric tissue and gastric adenocarincoma. a Histograms of the mRNA levels of PLK1 and FOXM1 relative to 18S mRNA in gastric tissue. Data was standardized relative to the gene expression in stock mRNA samples prepared from the Het1a cell line. The average relative mRNA level and standard deviations derived from two readings from one sample are shown. The individual tissue specimens are numbers and samples are grouped by tissue sub-types. The mean gene expression in each category is shown in red. Positive expression (calculated as two standard deviations above the mean of the value in normal samples) is illustrated by the horizontal dotted line. b Box plots of PLK1 and FOXM1 mRNA expression. The box plot demonstrates the interquartile range. Median expression values are indicated by the horizontal lines. c Scatterplot indicating the expression of FOXM1 relative to PLK1 mRNA expression. R2 value is indicated
