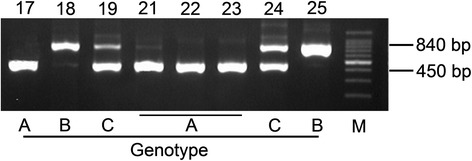
Fig. 1.

Different genotypic subgroups of C. albicans as determined by PCR. Lanes 17, 21, 22, and 23 show genotype A (the PCR amplification product is approximately 450 bp). Lanes 18 and 25 show genotype B (the PCR amplification product is approximately 840 bp). Lanes 19 and 24 show genotype C (two PCR amplification products: one band is approximately 450 bp, and the other band is approximately 840 bp)
