Figure 7.
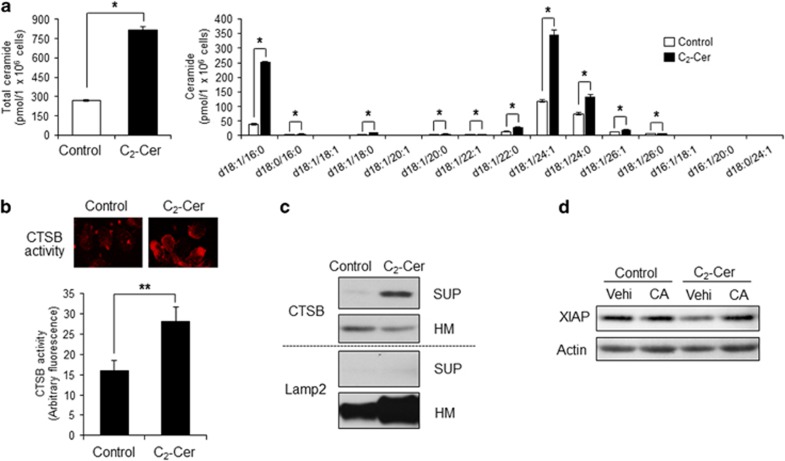
C2-ceramide induced activation and release of CTSB. (a) Cells were treated with 50 μM C2-ceramide (C2-Cer) for 6 h. Ceramide amounts were measured by LC-MS/MS. Values are mean±S.D. from three different experiments. *P<0.005. (b) Cells were treated with 50 μM C2-ceramide for 12 h. CTSB activity was measured by the Magic Red CTSB Activity Kit. Images were obtained by fluorescent microscopy. Values are mean±S.D. from three different experiments. *P<0.005, **P<0.05. (c) Release of CTSB was assessed by western blotting analysis after separating fractions of heavy membrane (HM) and cytosol (SUP). (d) XIAP levels were measured by immunoblotting using anti-XIAP antibodies. Results are representative of three independent experiments

