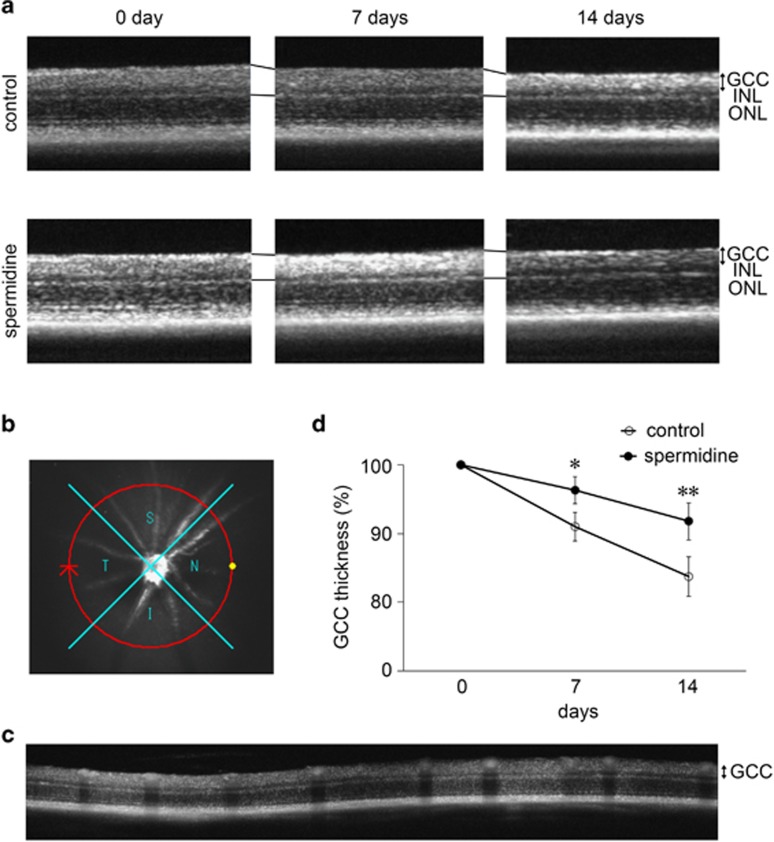
Figure 2.
In vivo imaging of the retina in control and spermidine-treated mice. (a) OCT cross-sectional images of retinas at d0, 7 and 14 following ONI. GCC, ganglion cell complex. (b) An image of a circle centering around the optic nerve disc. (c) An OCT circular scan image captured from b. (d) Longitudinal evaluation of the GCC thickness by a circular scan. The data are presented as means±S.E.M. of six samples for each experiment. *P<0.05, **P<0.01

