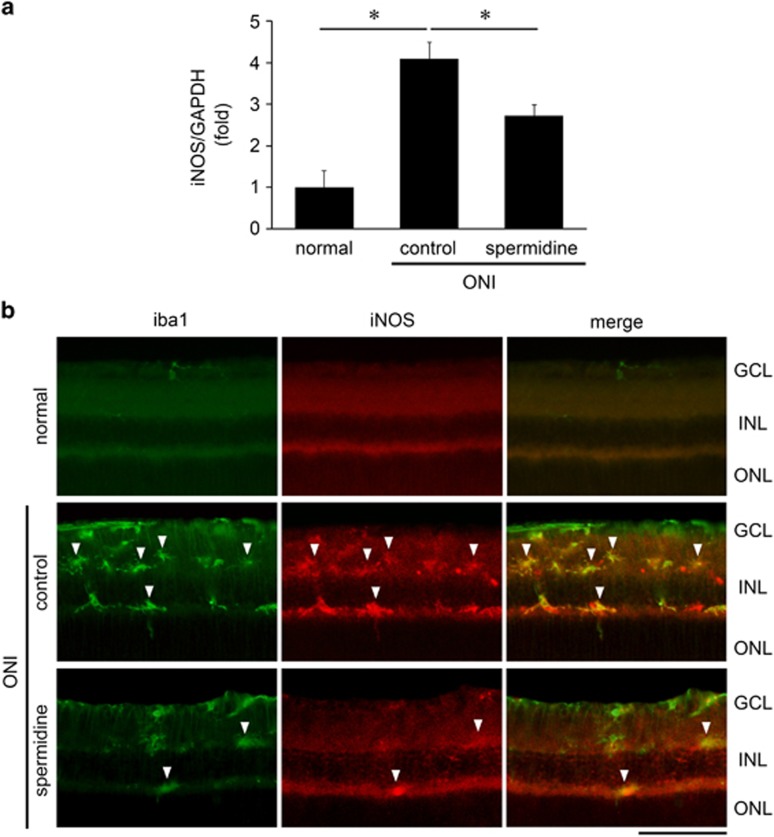
Figure 5.
Effects of spermidine on ONI-induced iNOS activation in the retina. (a) mRNA expression levels of iNOS at d5 after ONI were determined using quantitative real-time PCR. Glyceraldehyde 3-phosphate dehydrogenase (GAPDH) was used as an internal control. The data are presented as means±S.E.M. of six samples for each experiment. *P<0.05. (b) Double-labeling immunohistochemistry of iba1 (green) and iNOS (red) at d5 after ONI. Overlapping immunoreactivities (yellow, arrowheads) indicate the activated microglial cells that produce iNOS. Scale bar: 100 μm

