Figure 2.
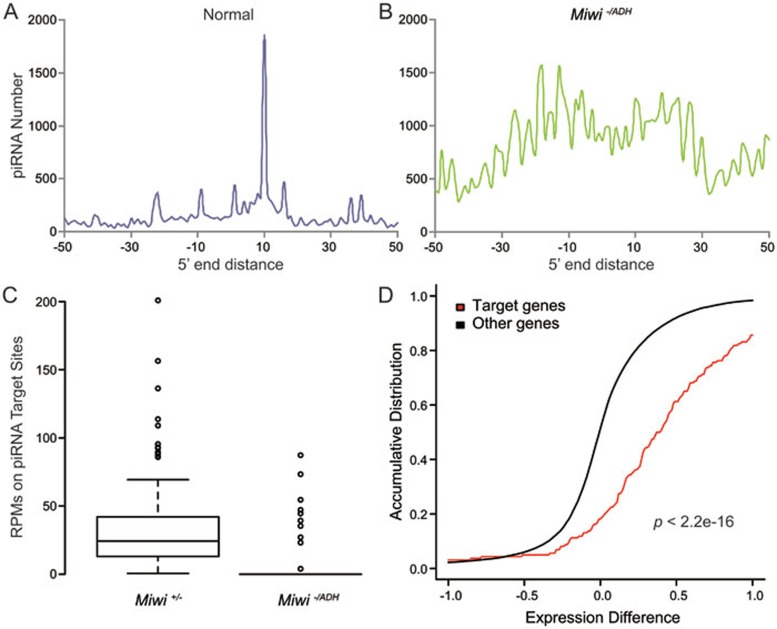
Meta-analyses of piRNA target mRNAs in mouse testes. (A, B) The distribution of potential piRNA target sites around cleaved mRNA fragments. The piRNA data are from normal (GSM822760, Miwi+/+) or the corresponding catalytic mutant (GSM822764, Miwi−/ADH) mice. The mRNA fragment data are from normal (GSM822765, Miwi+/−) or catalytic mutant (GSM822766, Miwi−/ADH) mice17. The X-axis shows the position of the 5′ end of potential mRNA-targeting piRNAs relative to the 5′ end of mRNA fragments. (C) Boxplot of distribution of mRNA fragment reads at potential MIWI/piRNA cleavage sites in control and catalytic mutant testes. (D) Accumulative distribution of expression difference of predicted piRNA target genes and non-targeted genes between the catalytic mutant (Miwi−/ADH) and control (Miwi+/−) samples (gene expression profiling data, GSE32180). The gene expression difference is presented as the averaged log2 expression of individual genes in the catalytic mutants minus the averaged log2 expression in controls. The P-value was calculated by Wilcoxon rank sum test.

