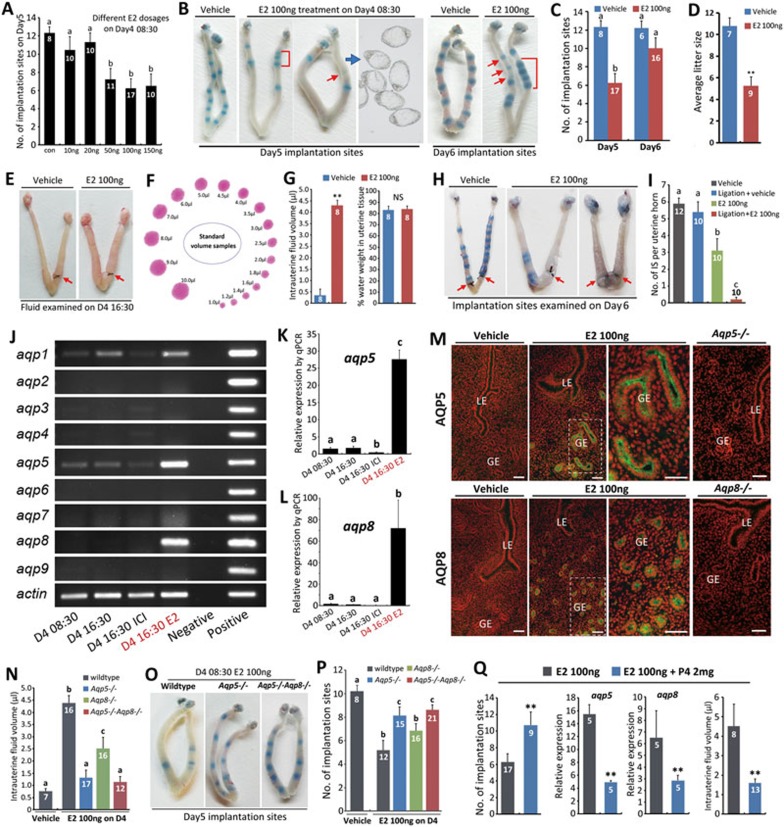
Figure 1.
Aqp5/8-dependent excessive intrauterine fluid accumulation contributes to hyper-E2-induced implantation failure. (A) Dose-dependent E2 effects on implantation. (B) Representative pictures of normal and abnormal implantation determined by the blue dye method (days 5 and 6). Each blue band indicates an implantation site. E2-treated group showed delayed implantation (red arrows) and crowded implantation sites (red brackets). (C) Number of implantation sites examined on days 5 and 6 revealed delayed implantation after E2 treatment. The bars with different letters are significantly different (P < 0.01) (D) Average litter size (**P < 0.01; student's t test). (E) Representative pictures of ligated uteri before intrauterine fluid release. Red arrows indicate ligation sites. (F) Standardized fluid-drop stains on a filter paper with defined volumes. (G) Intrauterine fluid volume and water weight percentage in uterine tissues. Water weight percentage = (wet uterus weight − dry uterus weight)/wet uterus weight × 100% (see detailed calculation in Supplementary information, Data S1). **P < 0.01, NS, P > 0.05; student's t test. (H, I) Representative pictures (H) and statistics (I) of implantation sites in ligated/unligated uteri with/without E2 treatment. Red arrows indicate ligation sites. The bars with different letters are significantly different (P < 0.01). (J) Expression profiles of aquaporin family members (Aqp1-9) in normal uteri from day 4 morning (D4 08:30), afternoon (D4 16:30) and from mice pretreated with ER antagonist ICI 182780 (D4 16:30 ICI) or E2 100 ng (D4 16:30 E2). (K, L) Analysis of Aqp5 (K) and Aqp8 (L) expression by real-time PCR. Data shown represent results from 5 independent experiments. The bars with different letters are significantly different (P < 0.01). (M) Immunofluorescence examination of Aqp5 and Aqp8 in day 4 16:30 uteri from wild-type mice with/without E2 treatment and from Aqp5−/− and Aqp8−/− mice with E2 treatment. Green staining indicates Aqp5 and Aqp8 expression and red staining represents propidium iodide-labeled nuclei. LE, luminal epithelium; GE, glandular epithelium. Scale bars, 100 μm. (N) Genetic ablation of Aqp5 and/or Aqp8 limited intrauterine fluid accumulation after E2 treatment. The bars with different letters are significantly different (P < 0.01). (O, P) Representative pictures (O) and statistics (P) showing that genetic ablation of Aqp5 and/or Aqp8 improves implantation after E2 treatment. The bars with different letters are significantly different (P < 0.01). (Q) P4 co-injection neutralized the adverse effects of E2 on Aqp5 and Aqp8 expression, intrauterine fluid volume and number of implantation sites. All error bars represent SEM. Numbers within/above bars indicate the number of mice/uteri examined.

